6.810 Engineering Interactive Technologies (fall 2021)
Pset 5: Touch Pressure and Gesture Recognition
In this problem set, you will visualize how hard the user is pressing with each finger on the multi-touch pad by visualizing touch pressure in 3D. After this, you will implement a gesture recognizer that can detect different finger gestures on your multi-touch pad and then execute the corresponding functionality.
Steps:
- Draw 3D Viewport for Touch Pressure Visualization
- Implement Camera Motion
- Draw Touch Pressure into 3D Viewport
- Visualize Multi-Touch Pad Pressure
- Learn about $1 Unistroke Gesture Recognizer
- Train Gesture and Connect to Call-Back Function
- Track and Visualize Gestures
- Implement Finger Gestures on Multi-Touch Pad
Get a new multi-touch pad from a TA:
If your printed multi-touch pad is degrading, let us know and we can give you one that we fabricated to test if it's really the multi-touch pad or something in your circuit/code.
Help us Improve Class Materials for PSet5:
Please let us know if anything was confusing in the write up.
You can add your comments here.
(1) Draw 3D Viewport for Touch Pressure Visualization
In the last pset, you detected touch location. Next, you will also detect touch pressure and visualize it in the user interface. To visualize the touch pressure, you are going to use a 3D visualization, in which the height of the touch point represents how much pressure is applied. Below you can see an example: on the left side only little pressure is applied and the touch bar is small, whereas on the right side a lot of pressure is applied and the bar is much higher.
No blob detection required:
To visualize touch pressure, you do not need to have a working blob detection. All you need is the scaled up image with the grayscale values. We will also work with prerecorded data first, and then only in the last step you will also try to connect your multi-touch pad.
Download Arduino Program that Writes Prerecorded Data to the Serial Port: Similar to pset4, you will first work on pre-recorded multi-touch data. This allows you to implement all steps based on the touch data we provide before testing your code with your own multi-touch pad in the last step. For now, all you need to do is to plug in your ESP (you do not need to plug in the rest of the circuit / multi-touch pad until the very last step). Download the Arduino program (.ino) from here that will write the prerecorded touch data to the Serial Port (this is the same program as in pset4). Compile it and upload it to your ESP microcontroller. The prerecorded data (same as in pset4) contains data for no touch, touch with one finger, and touch with two fingers.
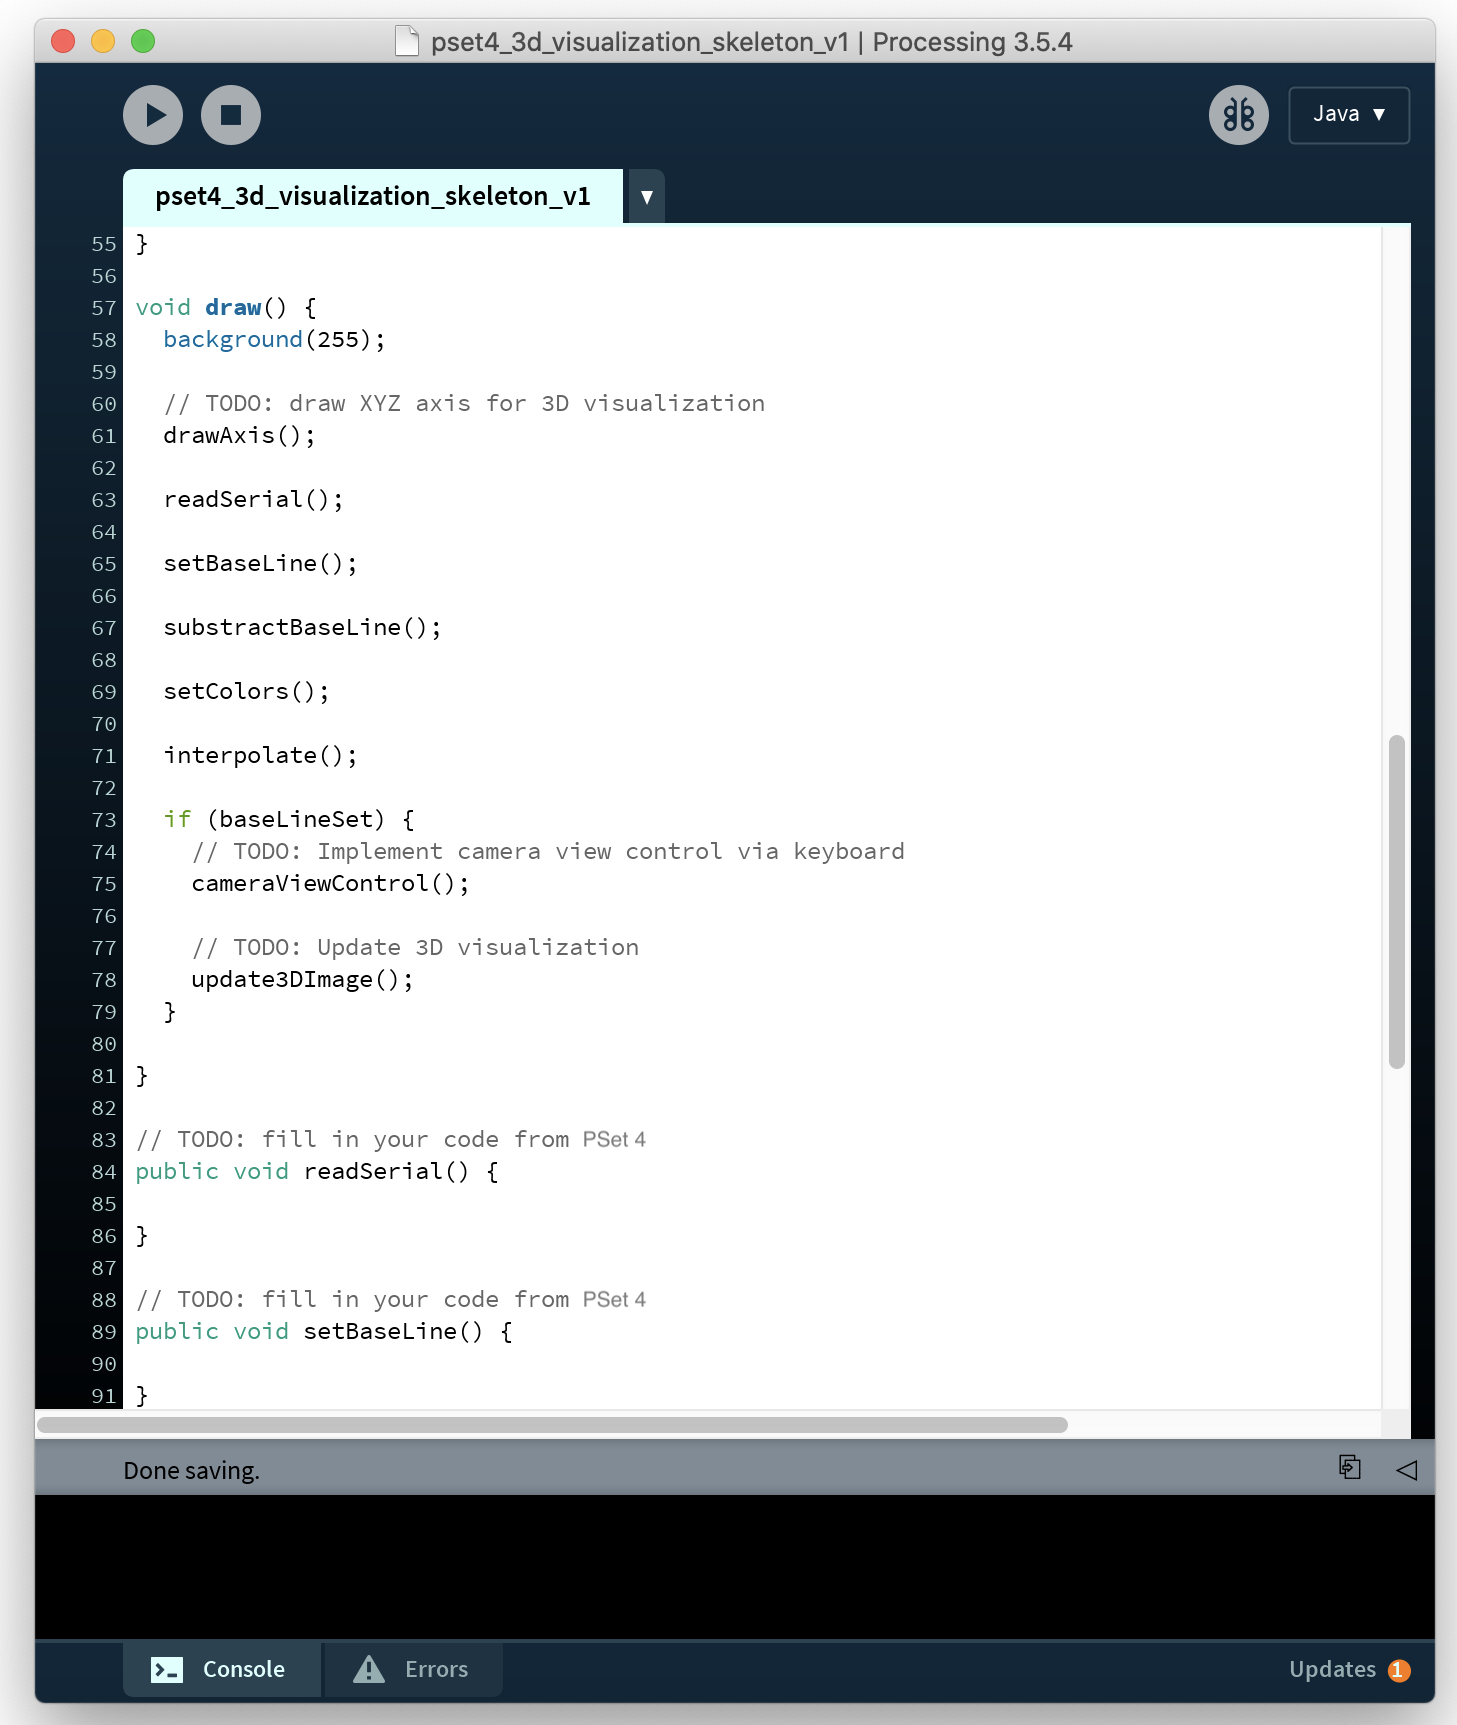
Download Skeleton Code for Visualization: You can download the skeleton code for this part of the pset from here. If you look at the code, you will see that we already defined several variables and functions for you that are related to the 3D visualization (e.g., the axis and camerapos parameters and the drawAxis(), cameraViewControl() and update3DImage() functions). In addition, you will see a few familiar functions from the previous psets (PSet4 & PSet5 Section (1) - (4)), including readSerial(), setBaseLine(), substractBaseLine(), interpolate(), and setColors(), which you can directly copy from your previous code.
Drawing the XYZ axes for 3D Visualization: Let's start by drawing the XYZ axes for 3D visualization in the drawAxis() function. Note that we are in 3D now not 2D so you need 3 coordinates for defining the positions of your points/lines.
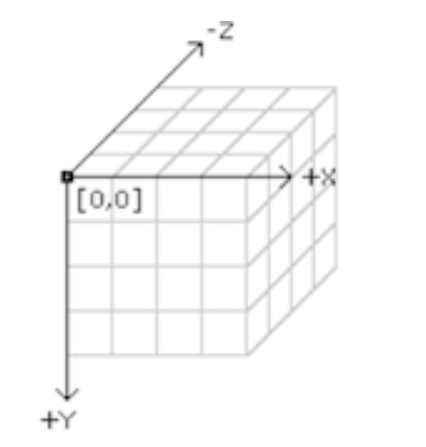
Direction of Axis: The question that arrises is which axis is x, y, and z and which way is positive and negative. In Processing, it uses the convention as shown below. Note that because of this convention, you need to draw the Y axis and the touch data on the y-axis in negative direction so it is pointing "up".
Length of Axis: The length of the x and y axes should be the width and height of your interpolated PImage.
The length of the Y axis should be slightly higher than the maximum pixel value (brightness) of your interpolated PImage so you have some space at the top.
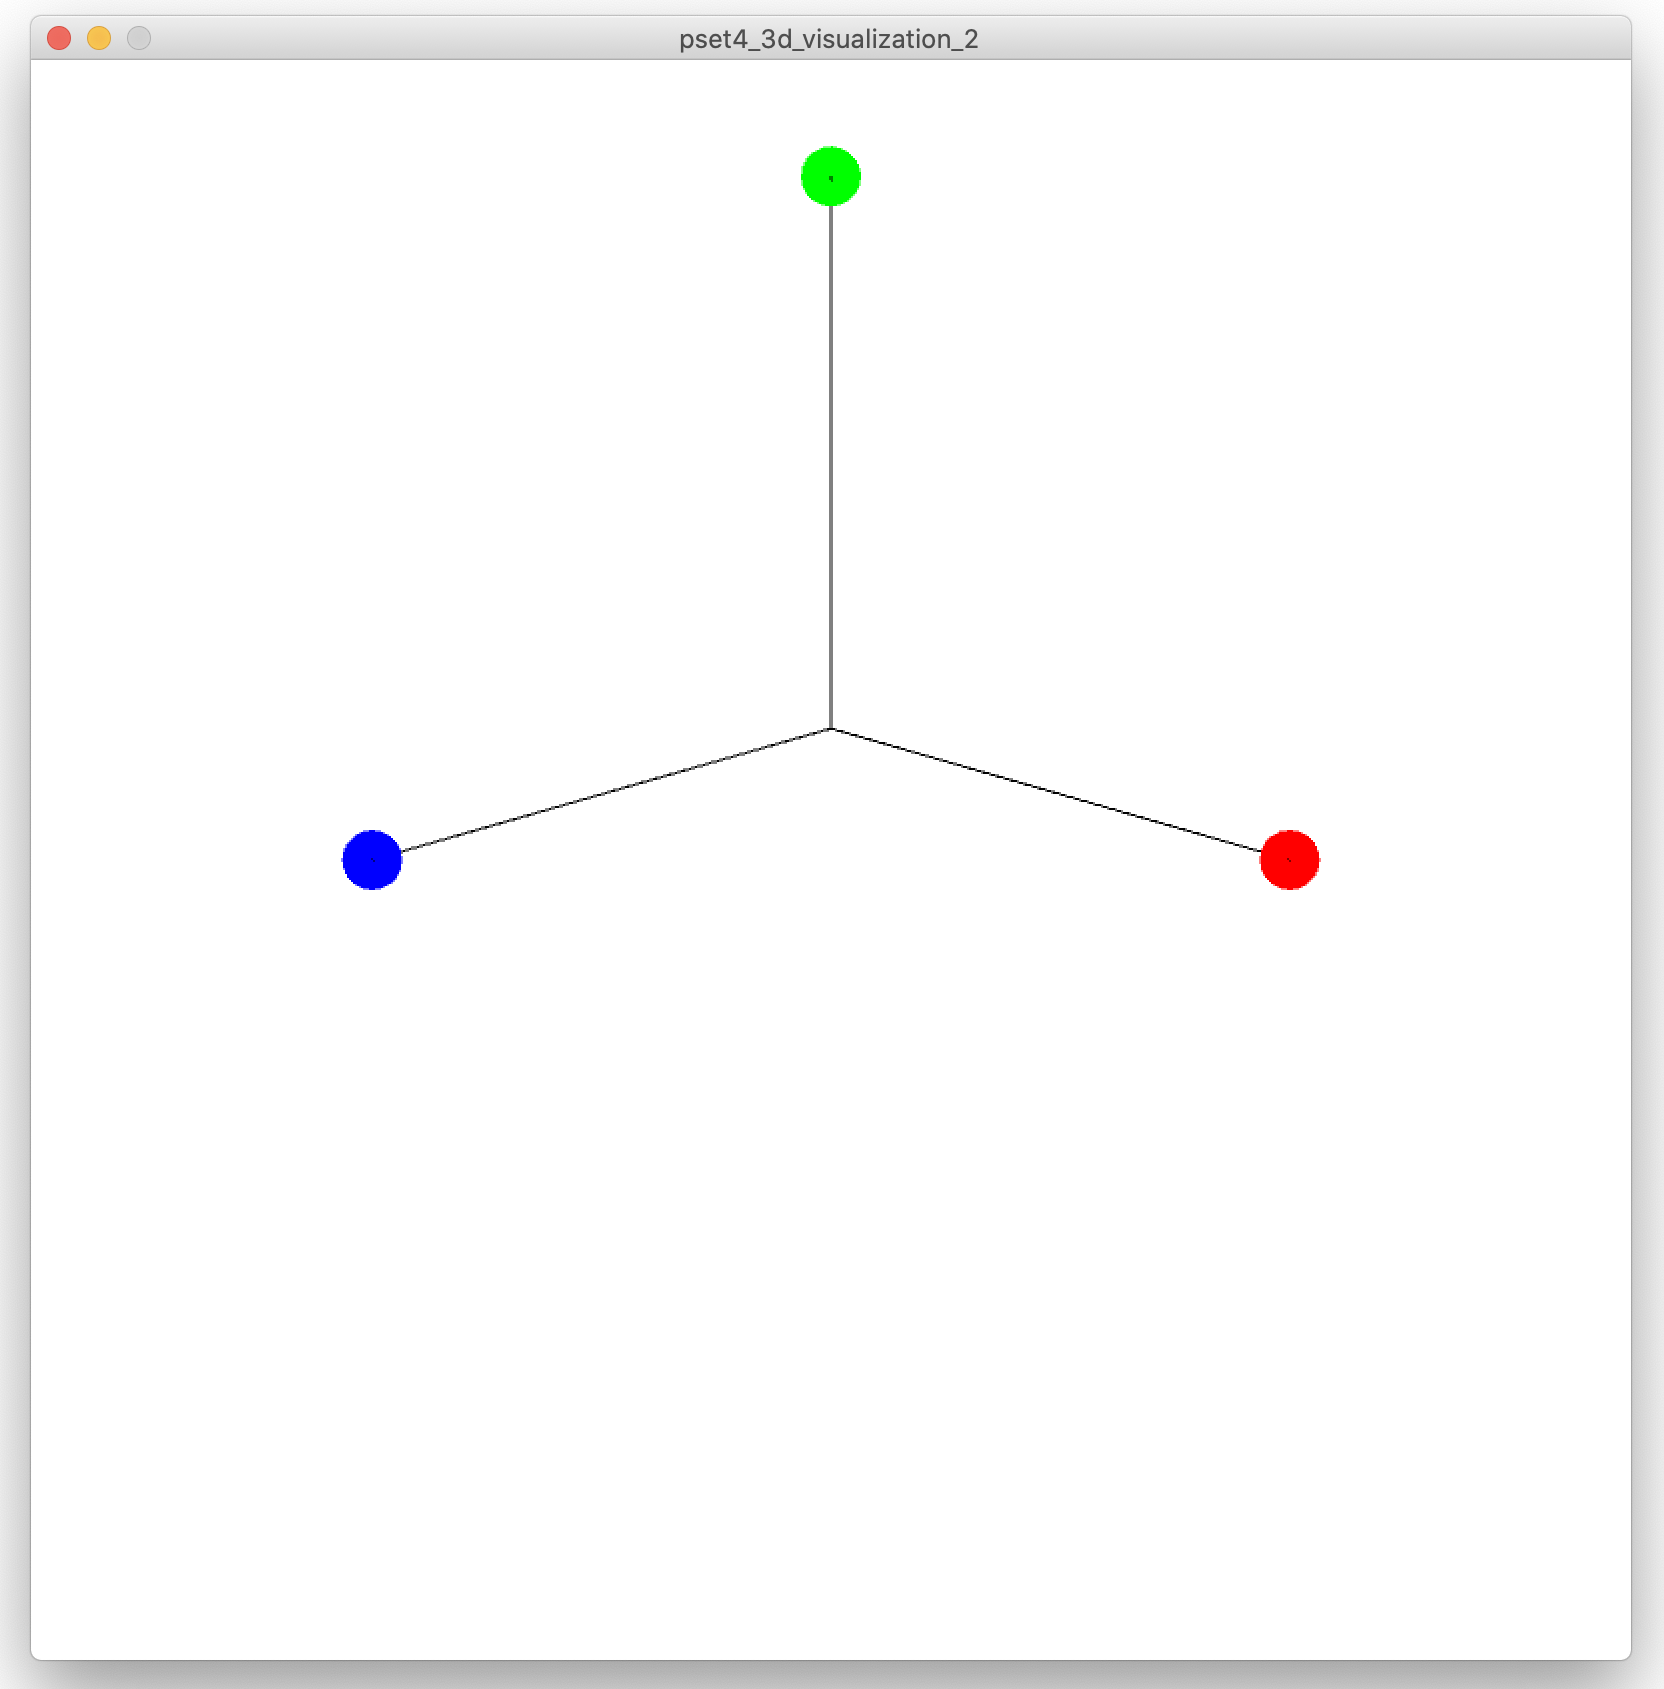
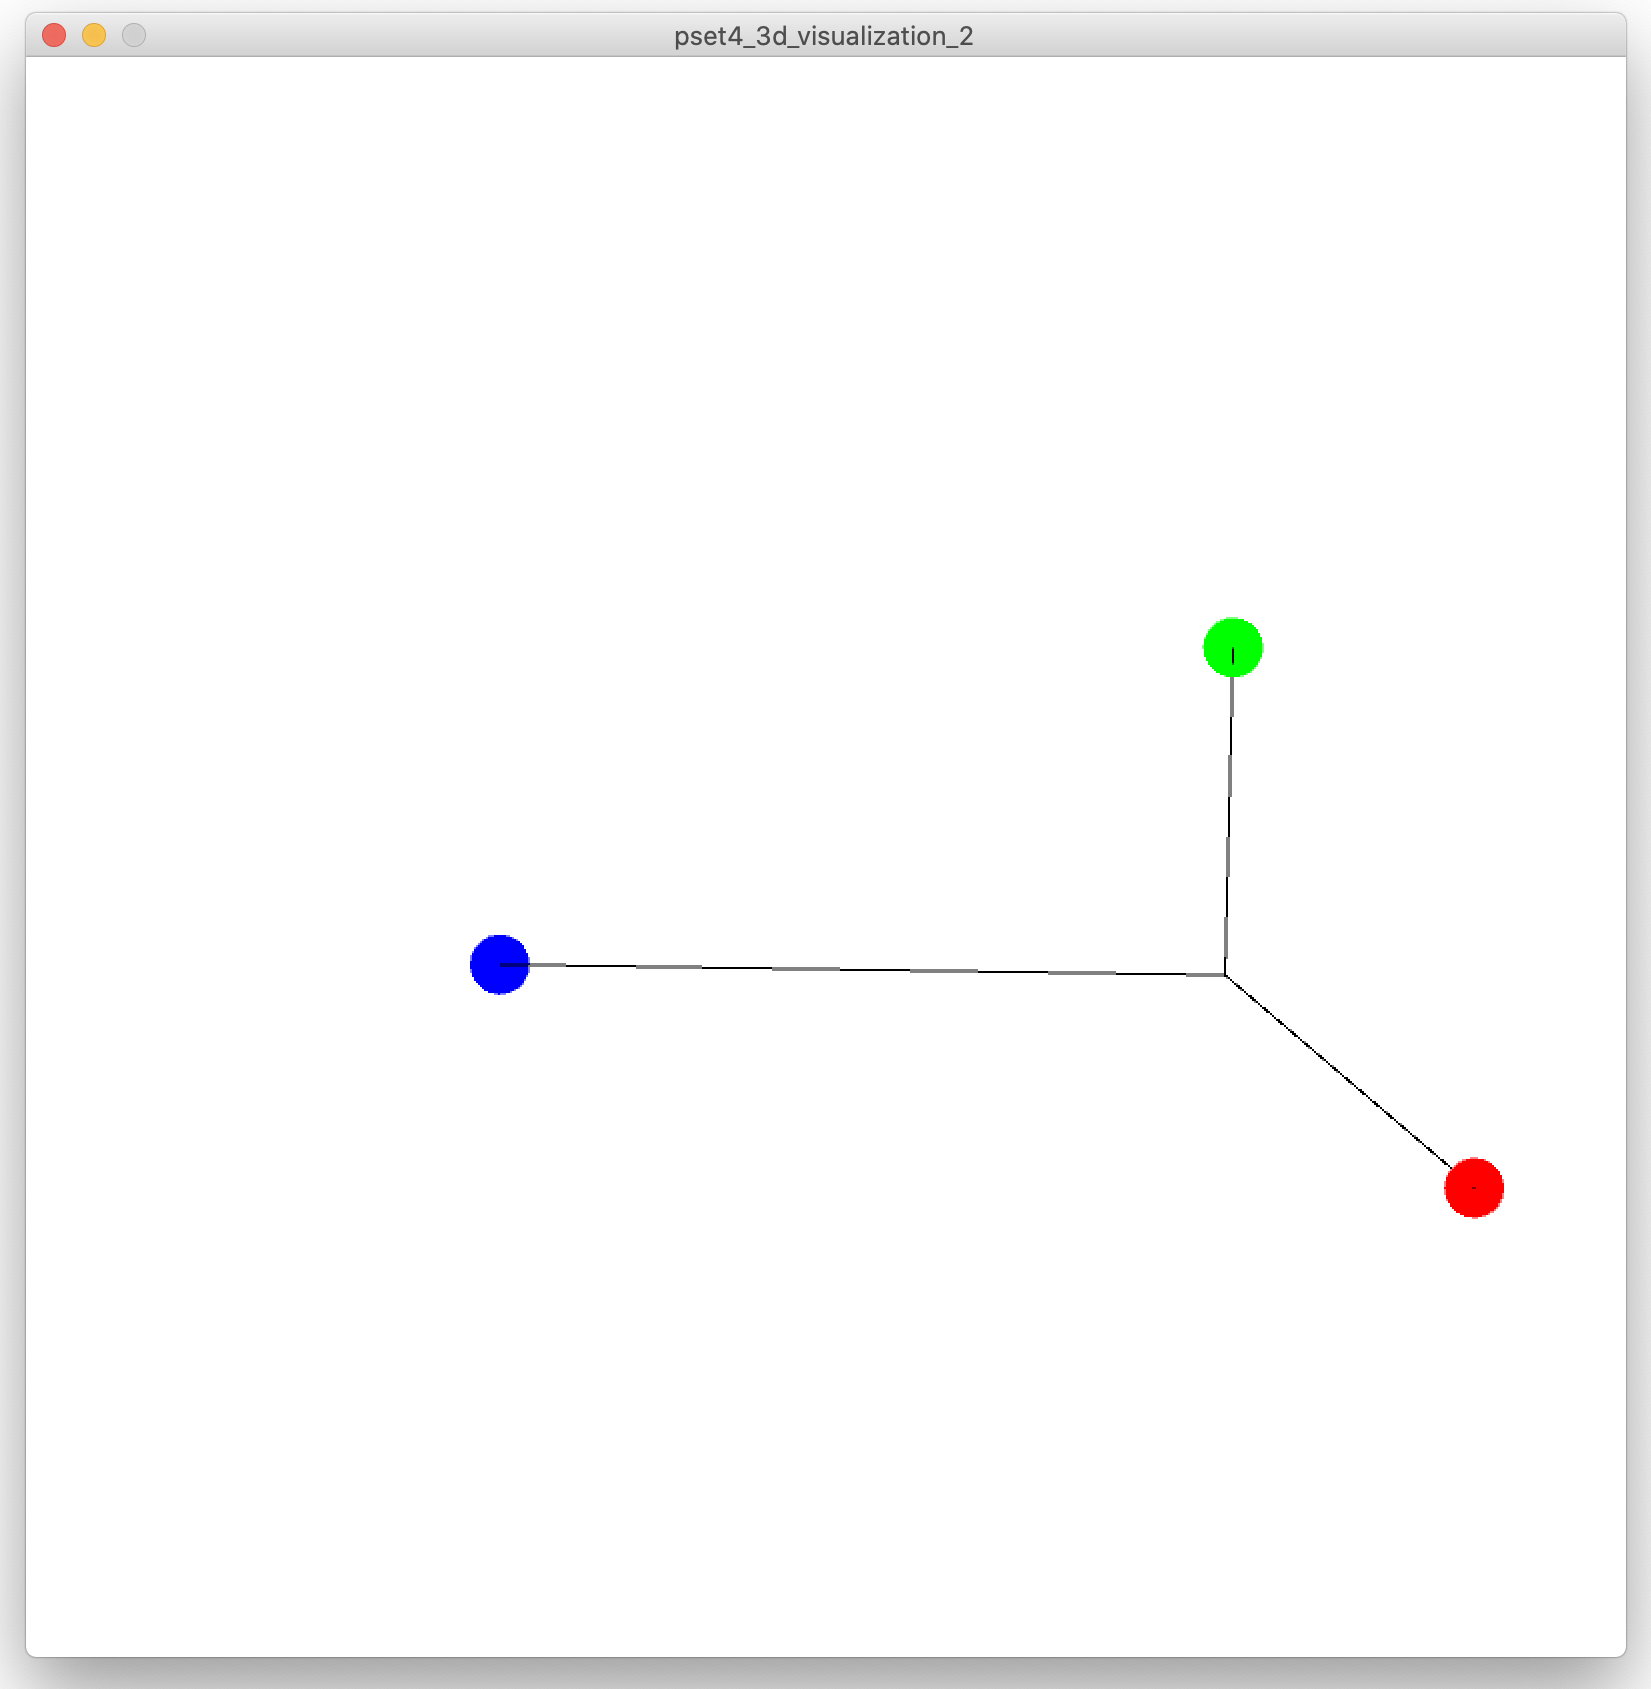
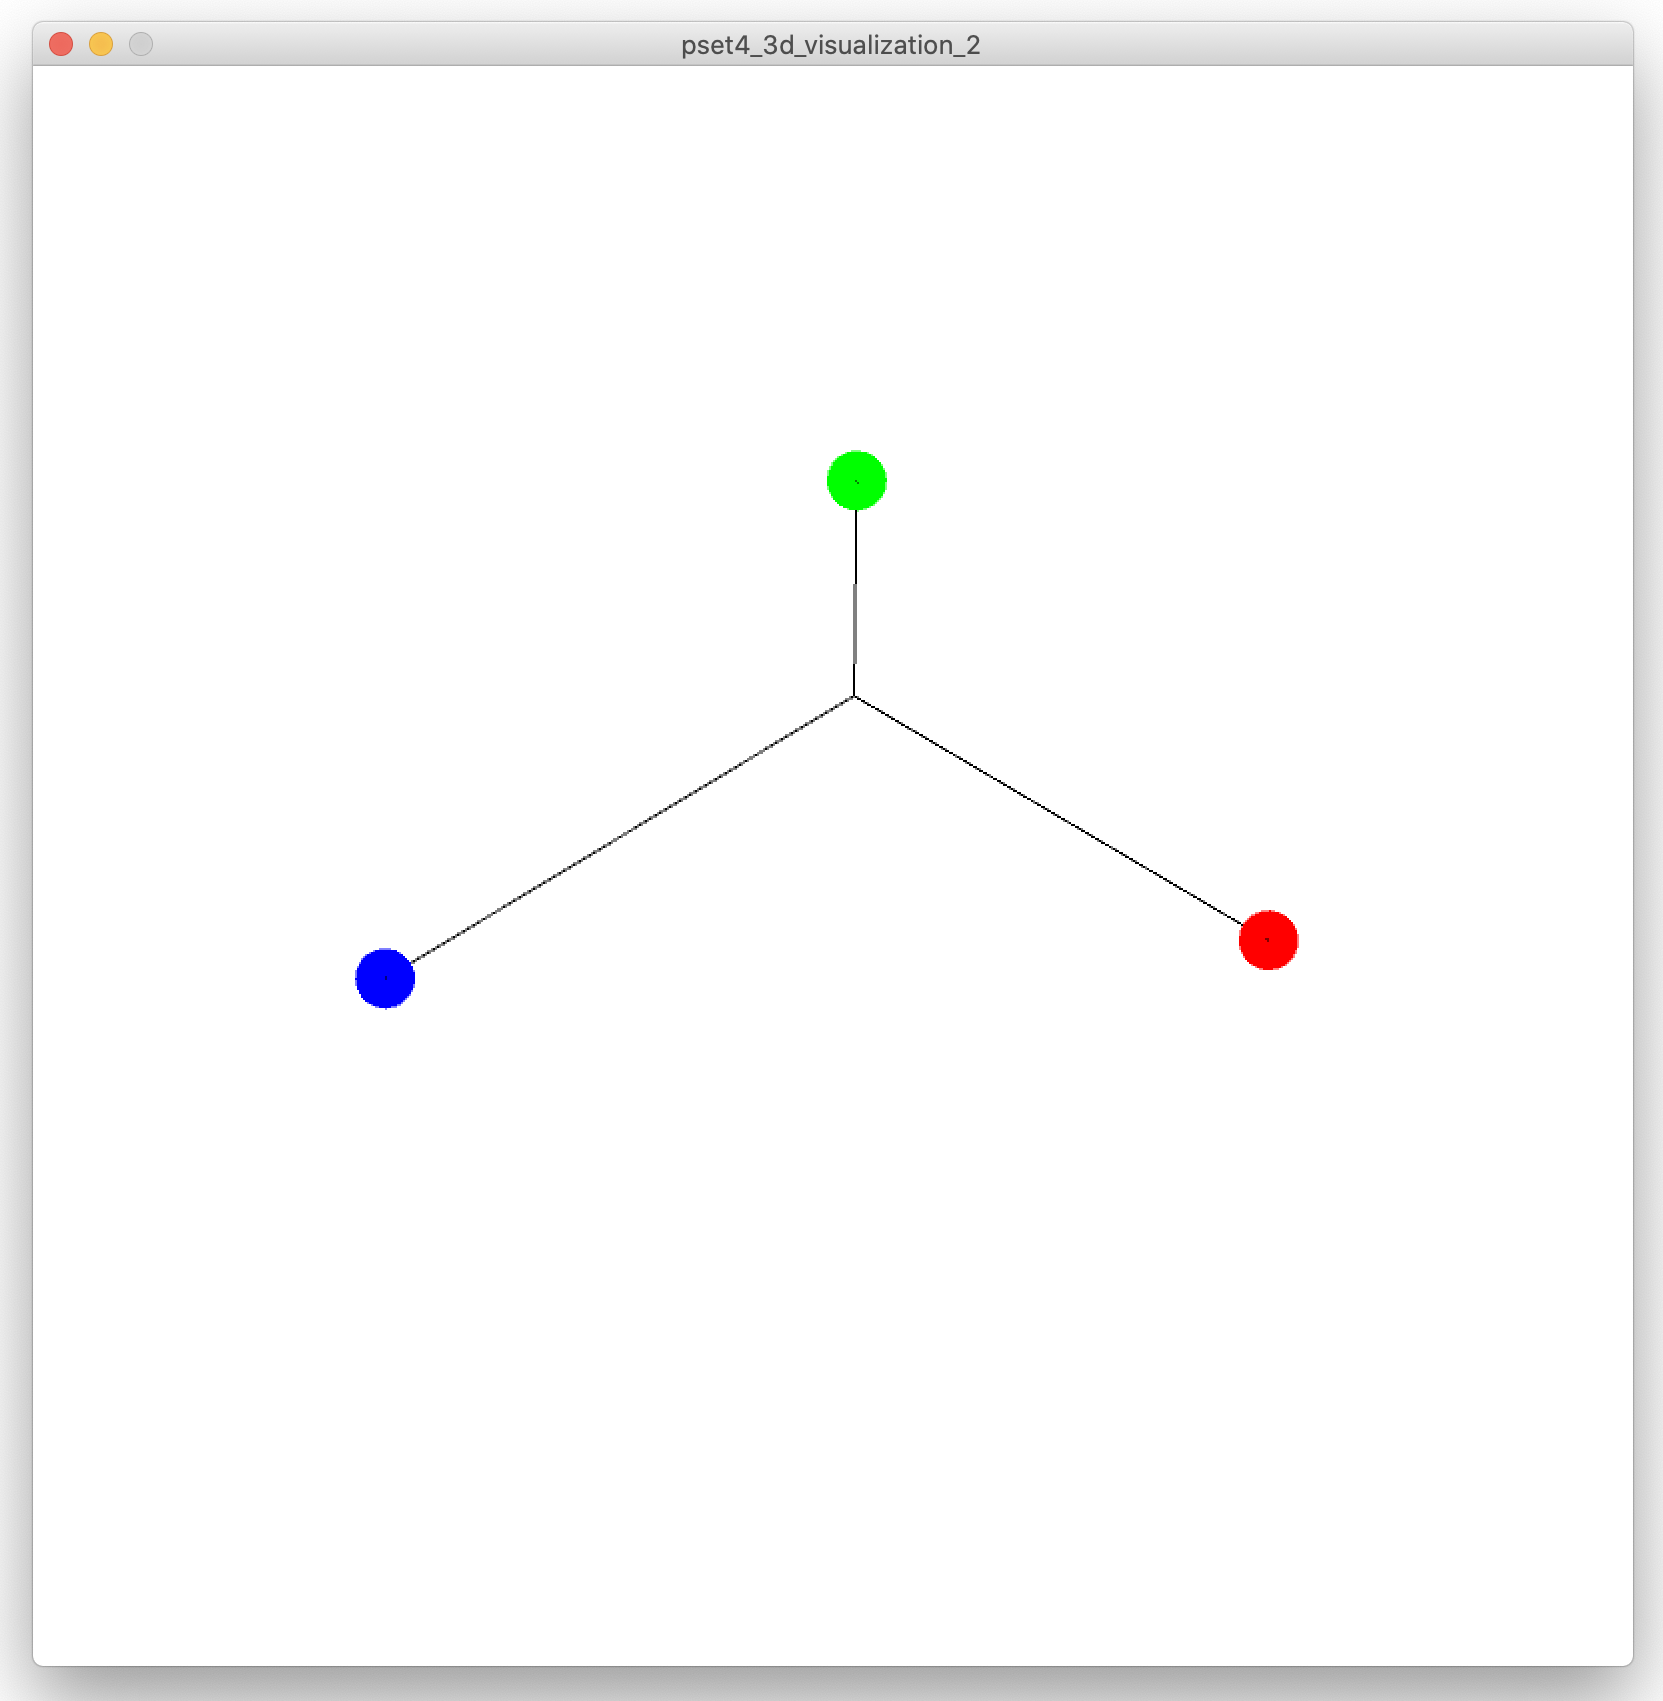
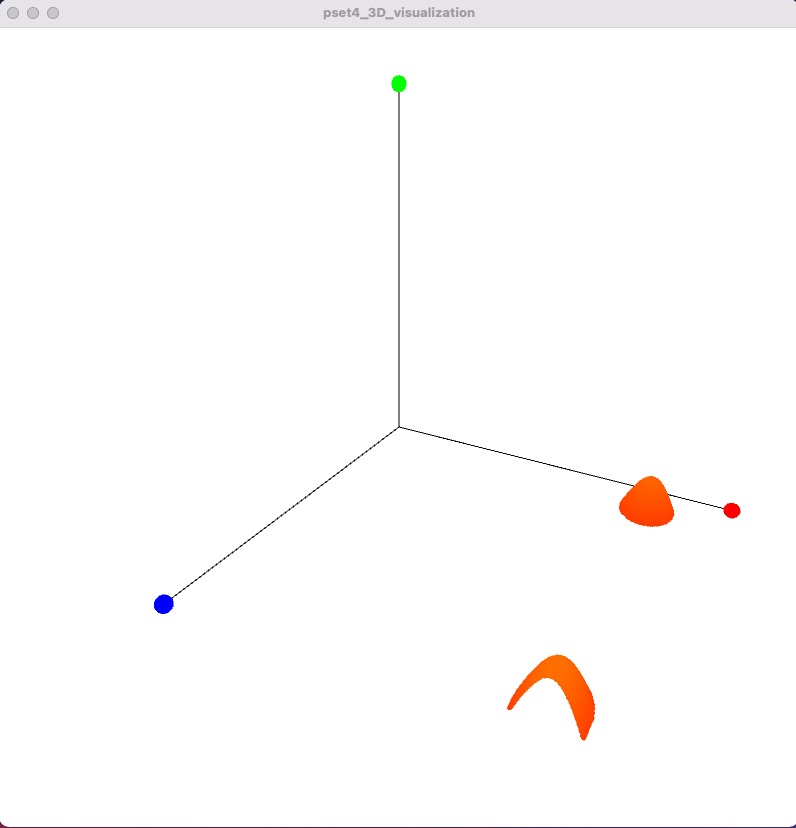
Color of the Axis: In addition to generating the axis lines, color the axis by drawing a colored dot at their end. We will use red for the x-axis, green for the y-axis, and blue for the z-axis (here "RGB" corresponds to "XYZ").
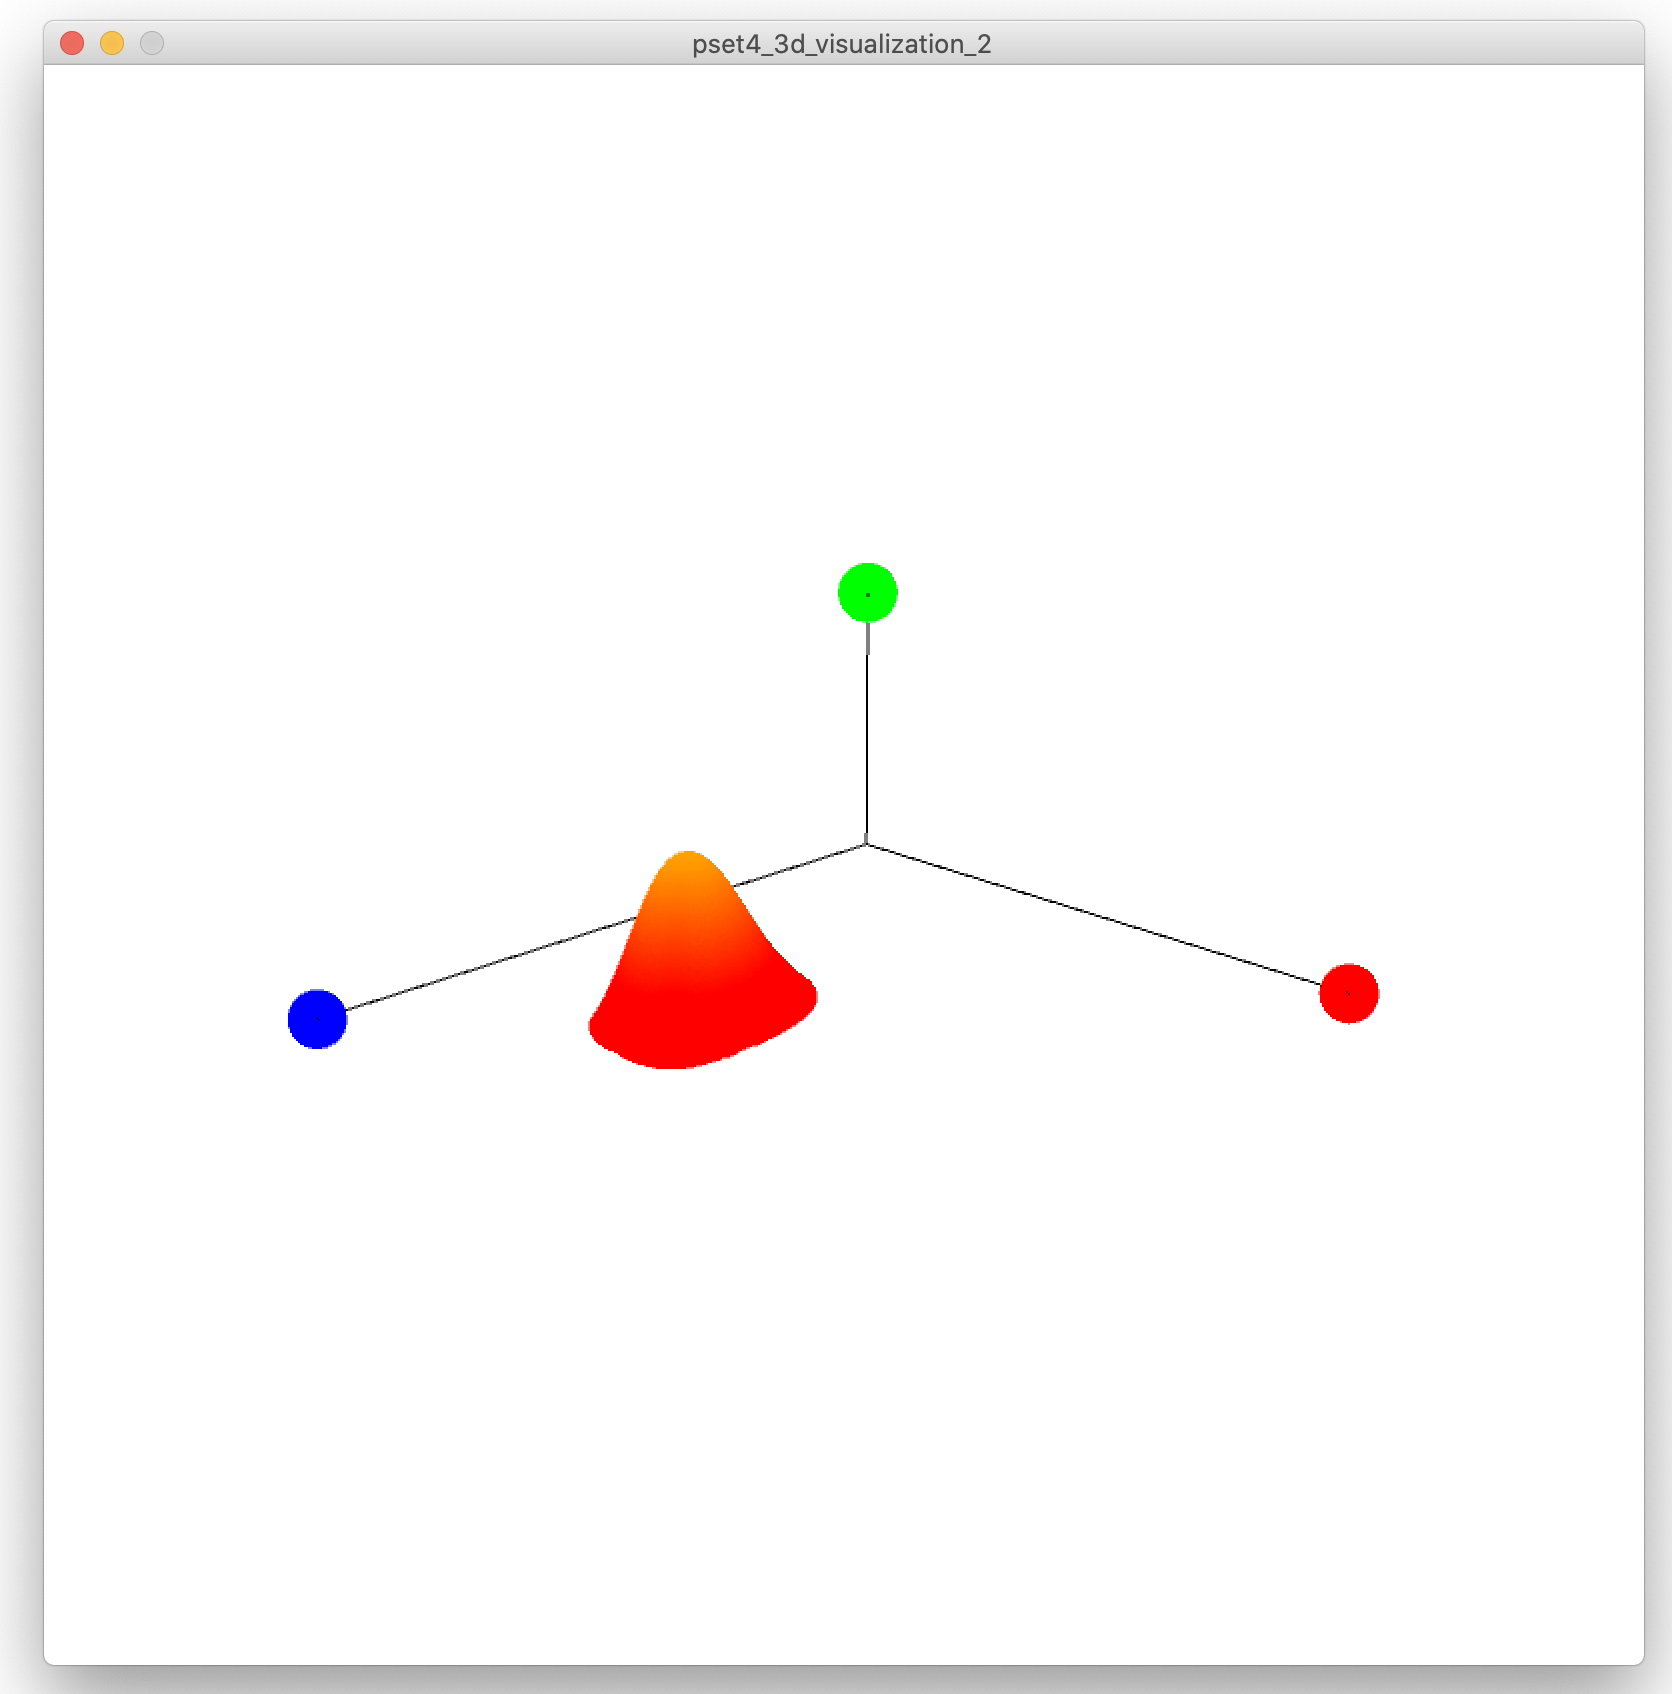
Once you finish the drawAxis() function, you should have something that looks like this (note that the height of your y-axis depends on the brightness values you get in your PImage and may not be shown to scale here):
(2) Implement Camera Motion
Without camera motion, it is kind of hard to see if you really succeeded in drawing your axis correctly or if it just 'looks' correct from the 2D perspective but in reality the lines are all over the place in 3D space. To facilitate debugging, we will implement camera control, i.e. you will be able to move around the camera by pressing keys on the keyboard to zoom in/out and move the camera around the scene.
Initialize Camera in Processing: Processing provides a Camera Class for implementing camera movement. You can find the camera class documentation here. To get started, initialize a new camera in Processing with the following method:
camera(float eyeX, float eyeY, float eyeZ, float centerX, float centerY, float centerZ, float upX, float upY, float upZ);
eye x/y/z: This is the camera's 3D position in space, i.e. where it would be physically located if it was a camera in real-life.
center x/y/z: The center of the scene defines how the camera is angled. For instance, if the center of the scene is lower than the camera position ('eye'), then the camera will look down, resulting in a bird's eye view. Similarly, if the center of the scene is higher than the camera, then the camera will look up, resulting in a frog's eye view.
upX/Y/Z: This defines which axis is facing upwards. You can use values -1, 0, and 1. If you use -1, the camera will be flipped and face up-side-down. In our case, we want to keep it simple and use for x,y,z 0,1,0 since y is pointing upwards.
When you initialize your camera, you may want to start by using the default parameter values we provide in the code, which should give you a reasonable start for a good viewport. If you see nothing in your view after initializing the camera, you may be facing the wrong way with you camera, e.g. the scene may be behind you, which causes you to only see a white screen with nothing on it.
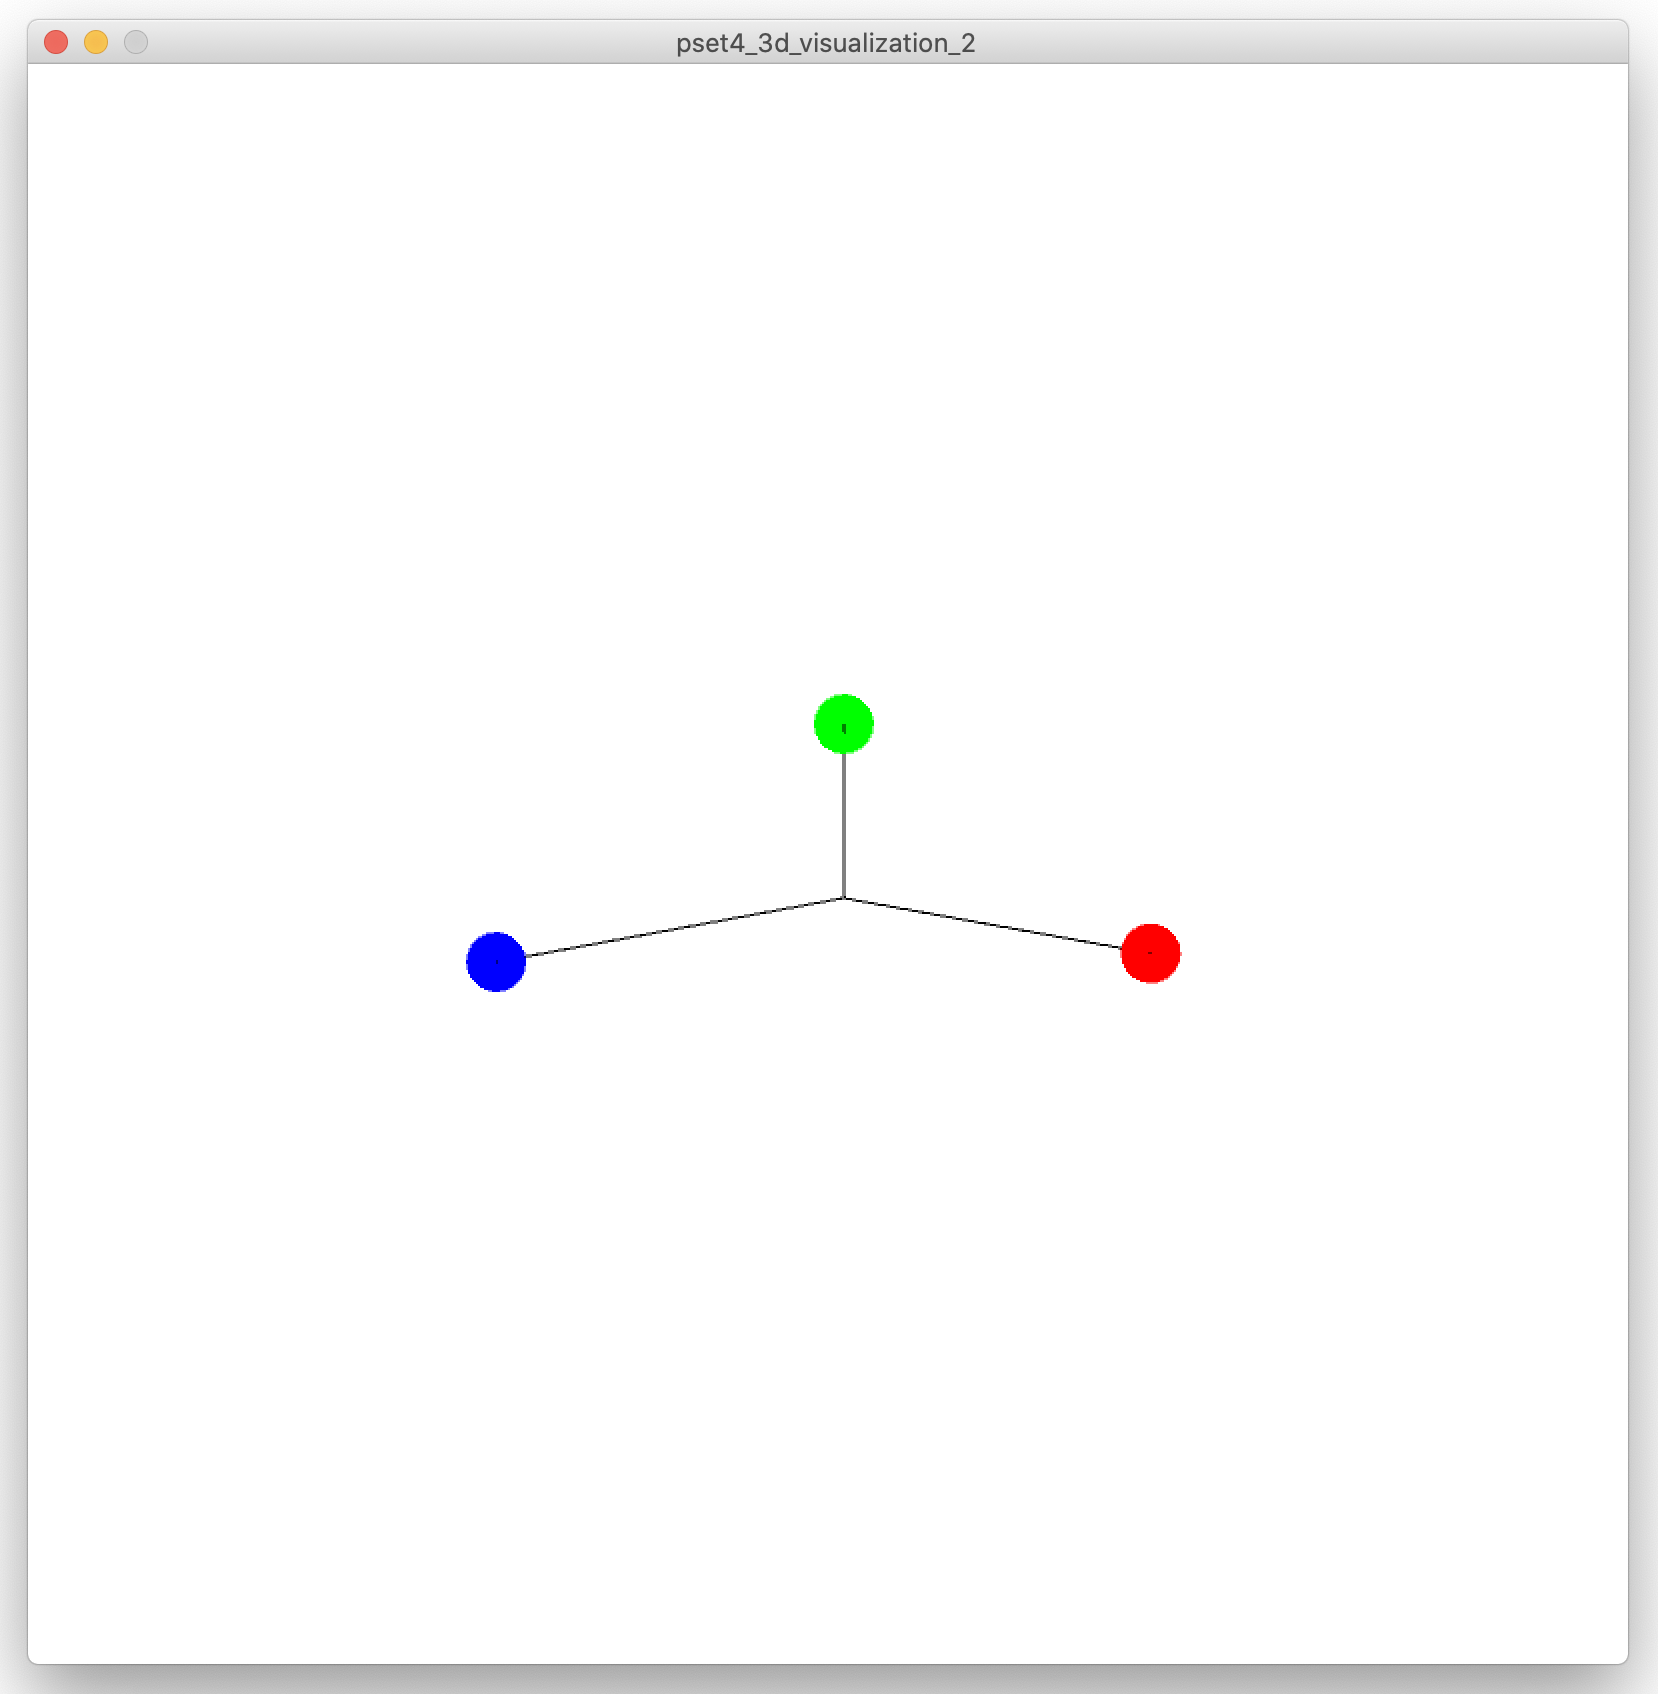
Zooming in/out: Moving the camera (eye position) closer or further away from the 3D visualization results in a zooming in/out effect (see images below). Implement a zooming effect so that when you press the key "E" you zoom in and if you press the key "Q" you zoom out.
Adjusting Frame Rate: If you are experiencing some lagging in your application, you can also set the frame rate for the camera for better performance using the line below:
frameRate(30);
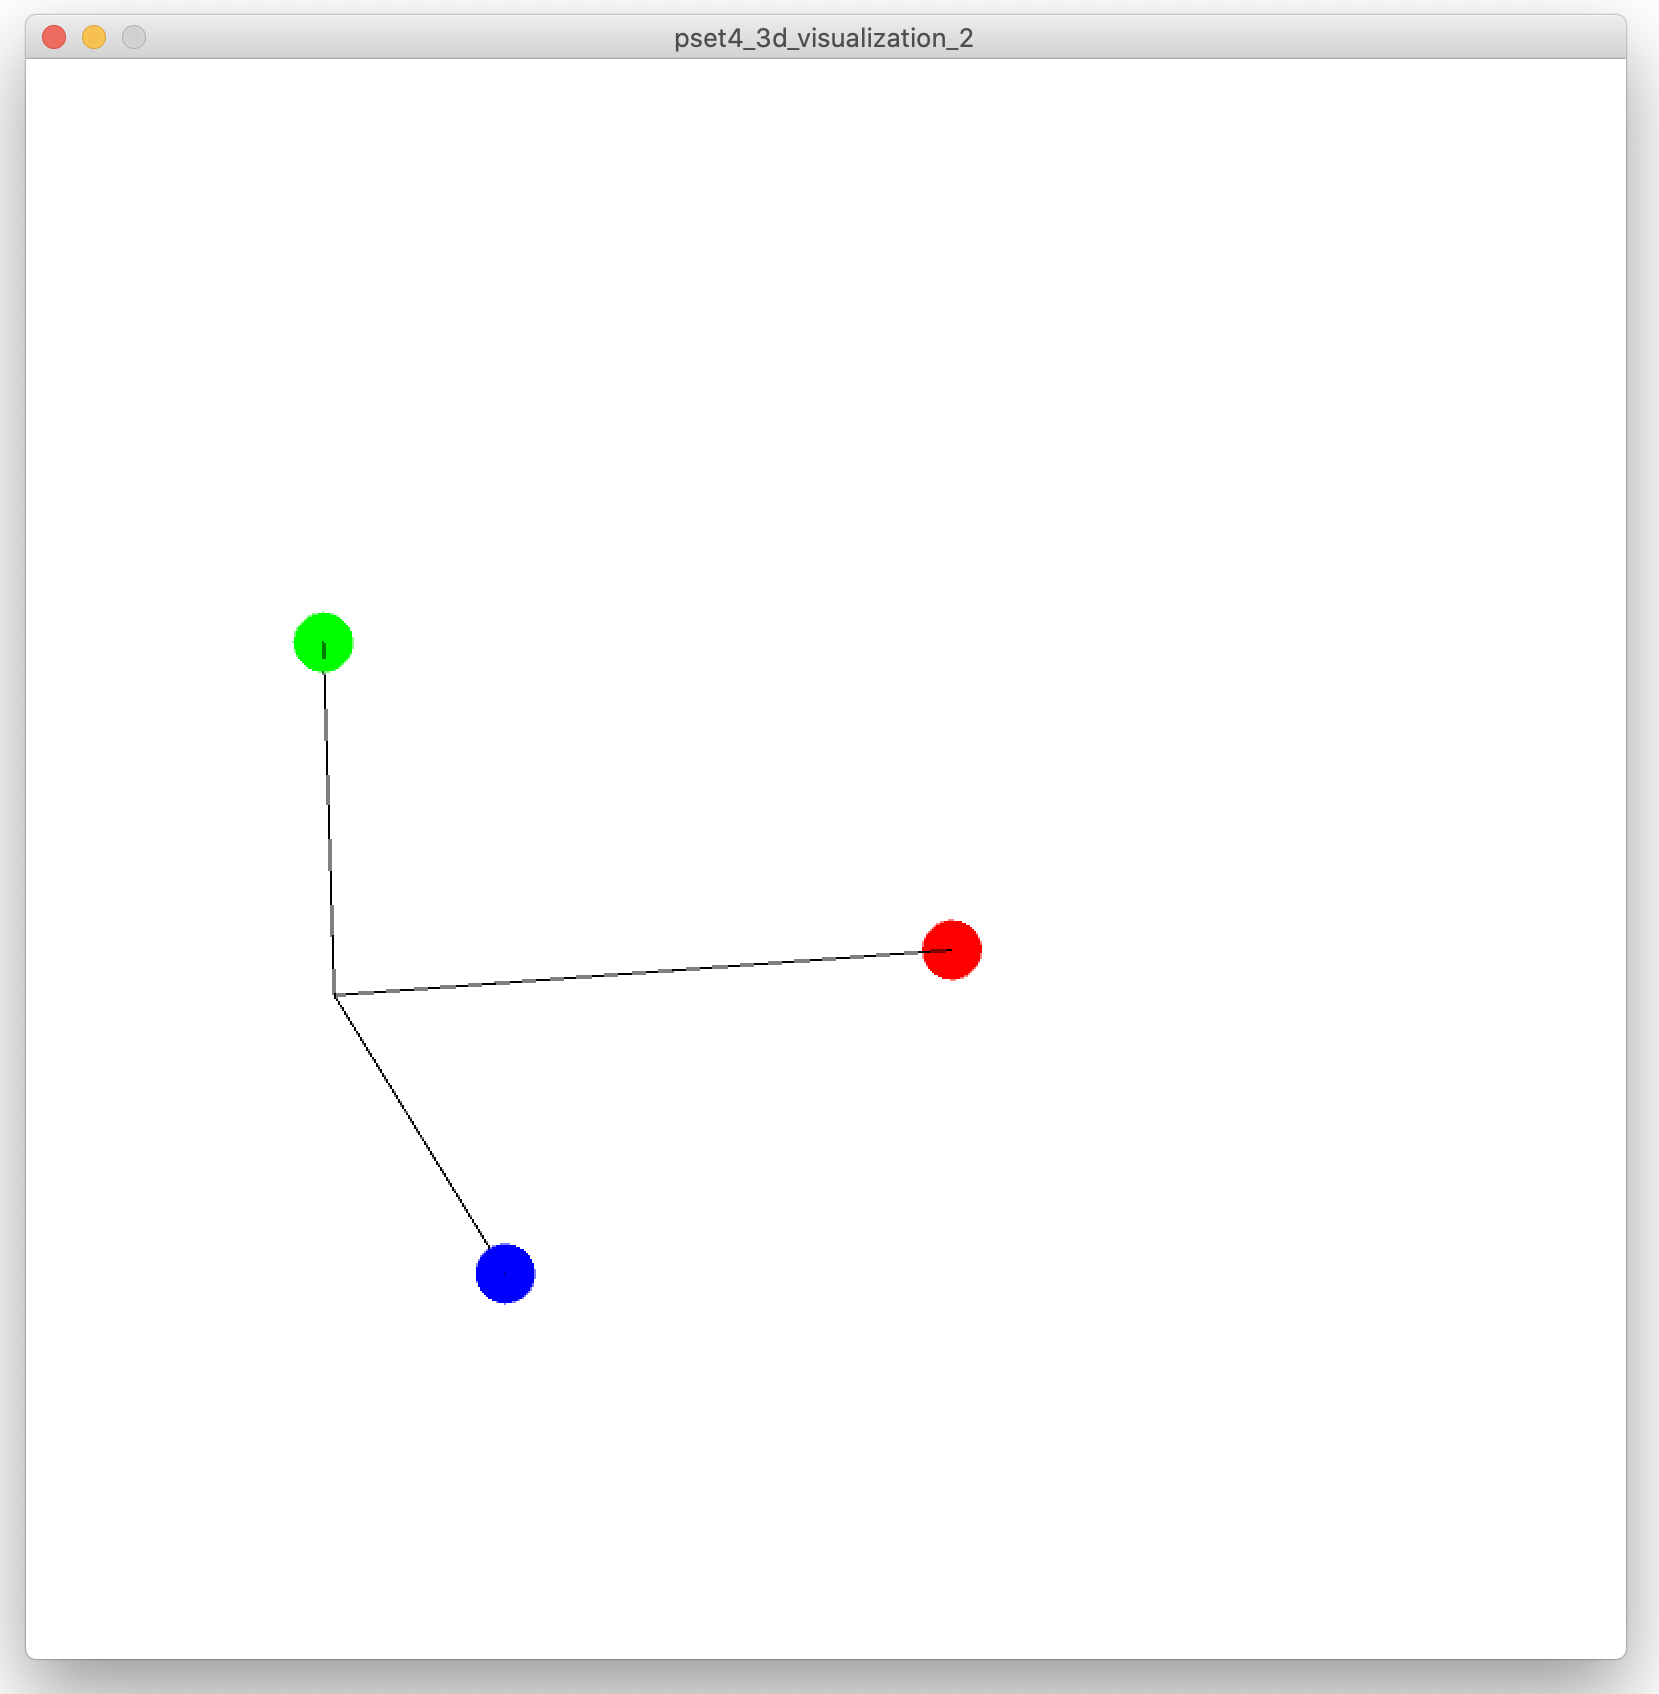
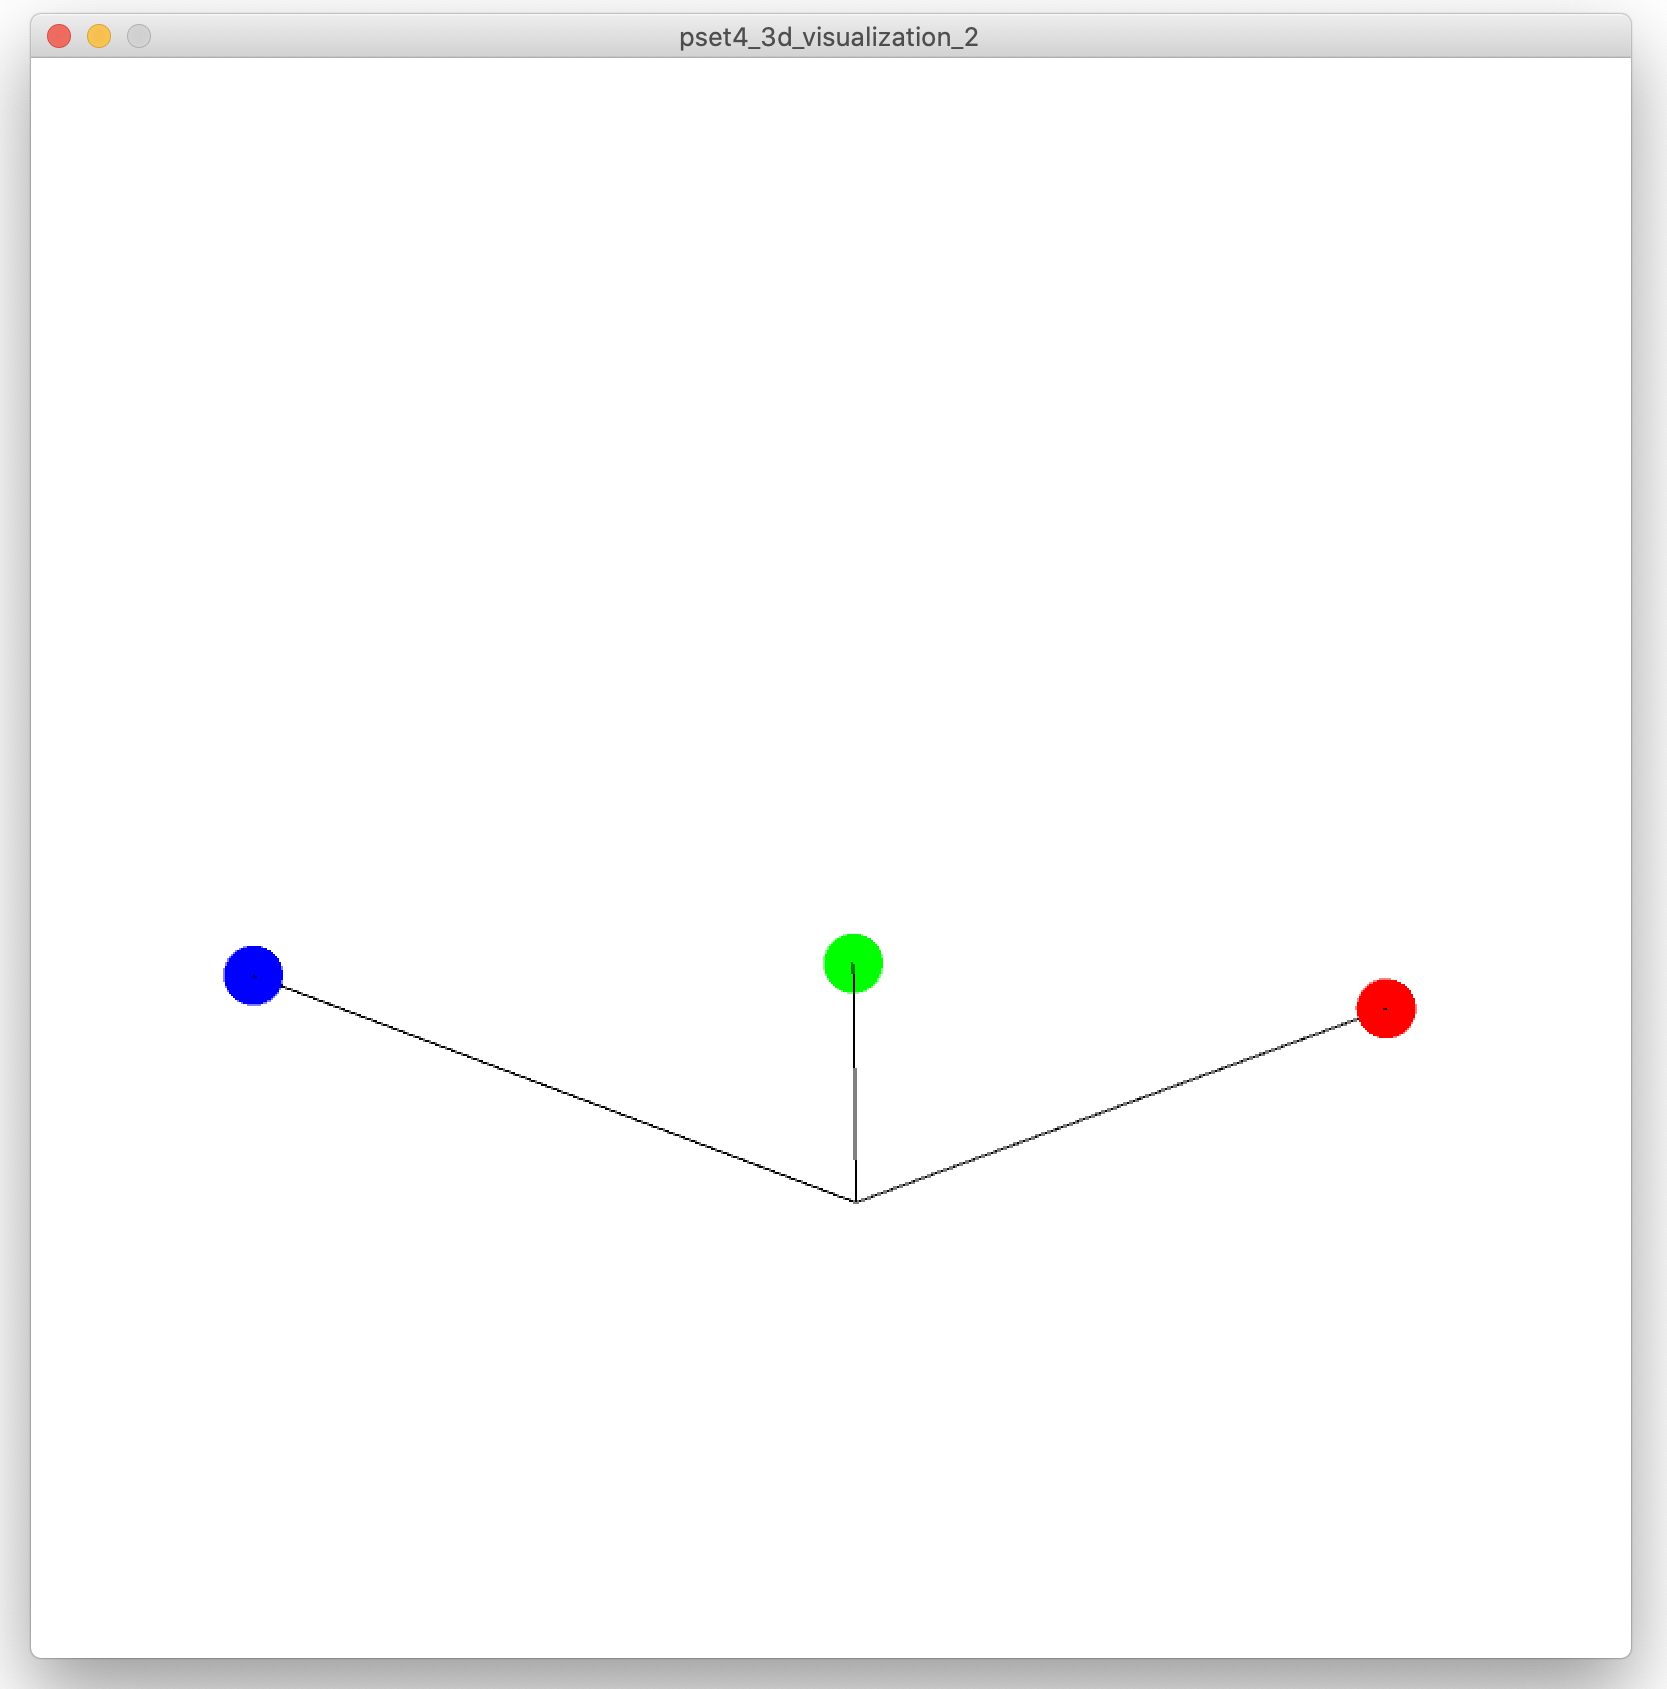
Rotating in the X-Z Plane: To move the camera in the x-z plane around the 3D visualization, you need to keep it at the same distance from the 3D visualization at all times (see images below). This is best accomplished by moving the camera on a circle around the scene. Update the camera position (eye position) to accomplish this (you have to do some math here, check out how radians work again to help you with this). If you press the key 'D' rotate right and if you press the key 'A' rotate left. Note that you only have to update the camera's position. Since you set the scene's center x/y/z to be the location of your 3D visualization, the camera will automatically rotate while moving around the 3D visualization and always look at it.
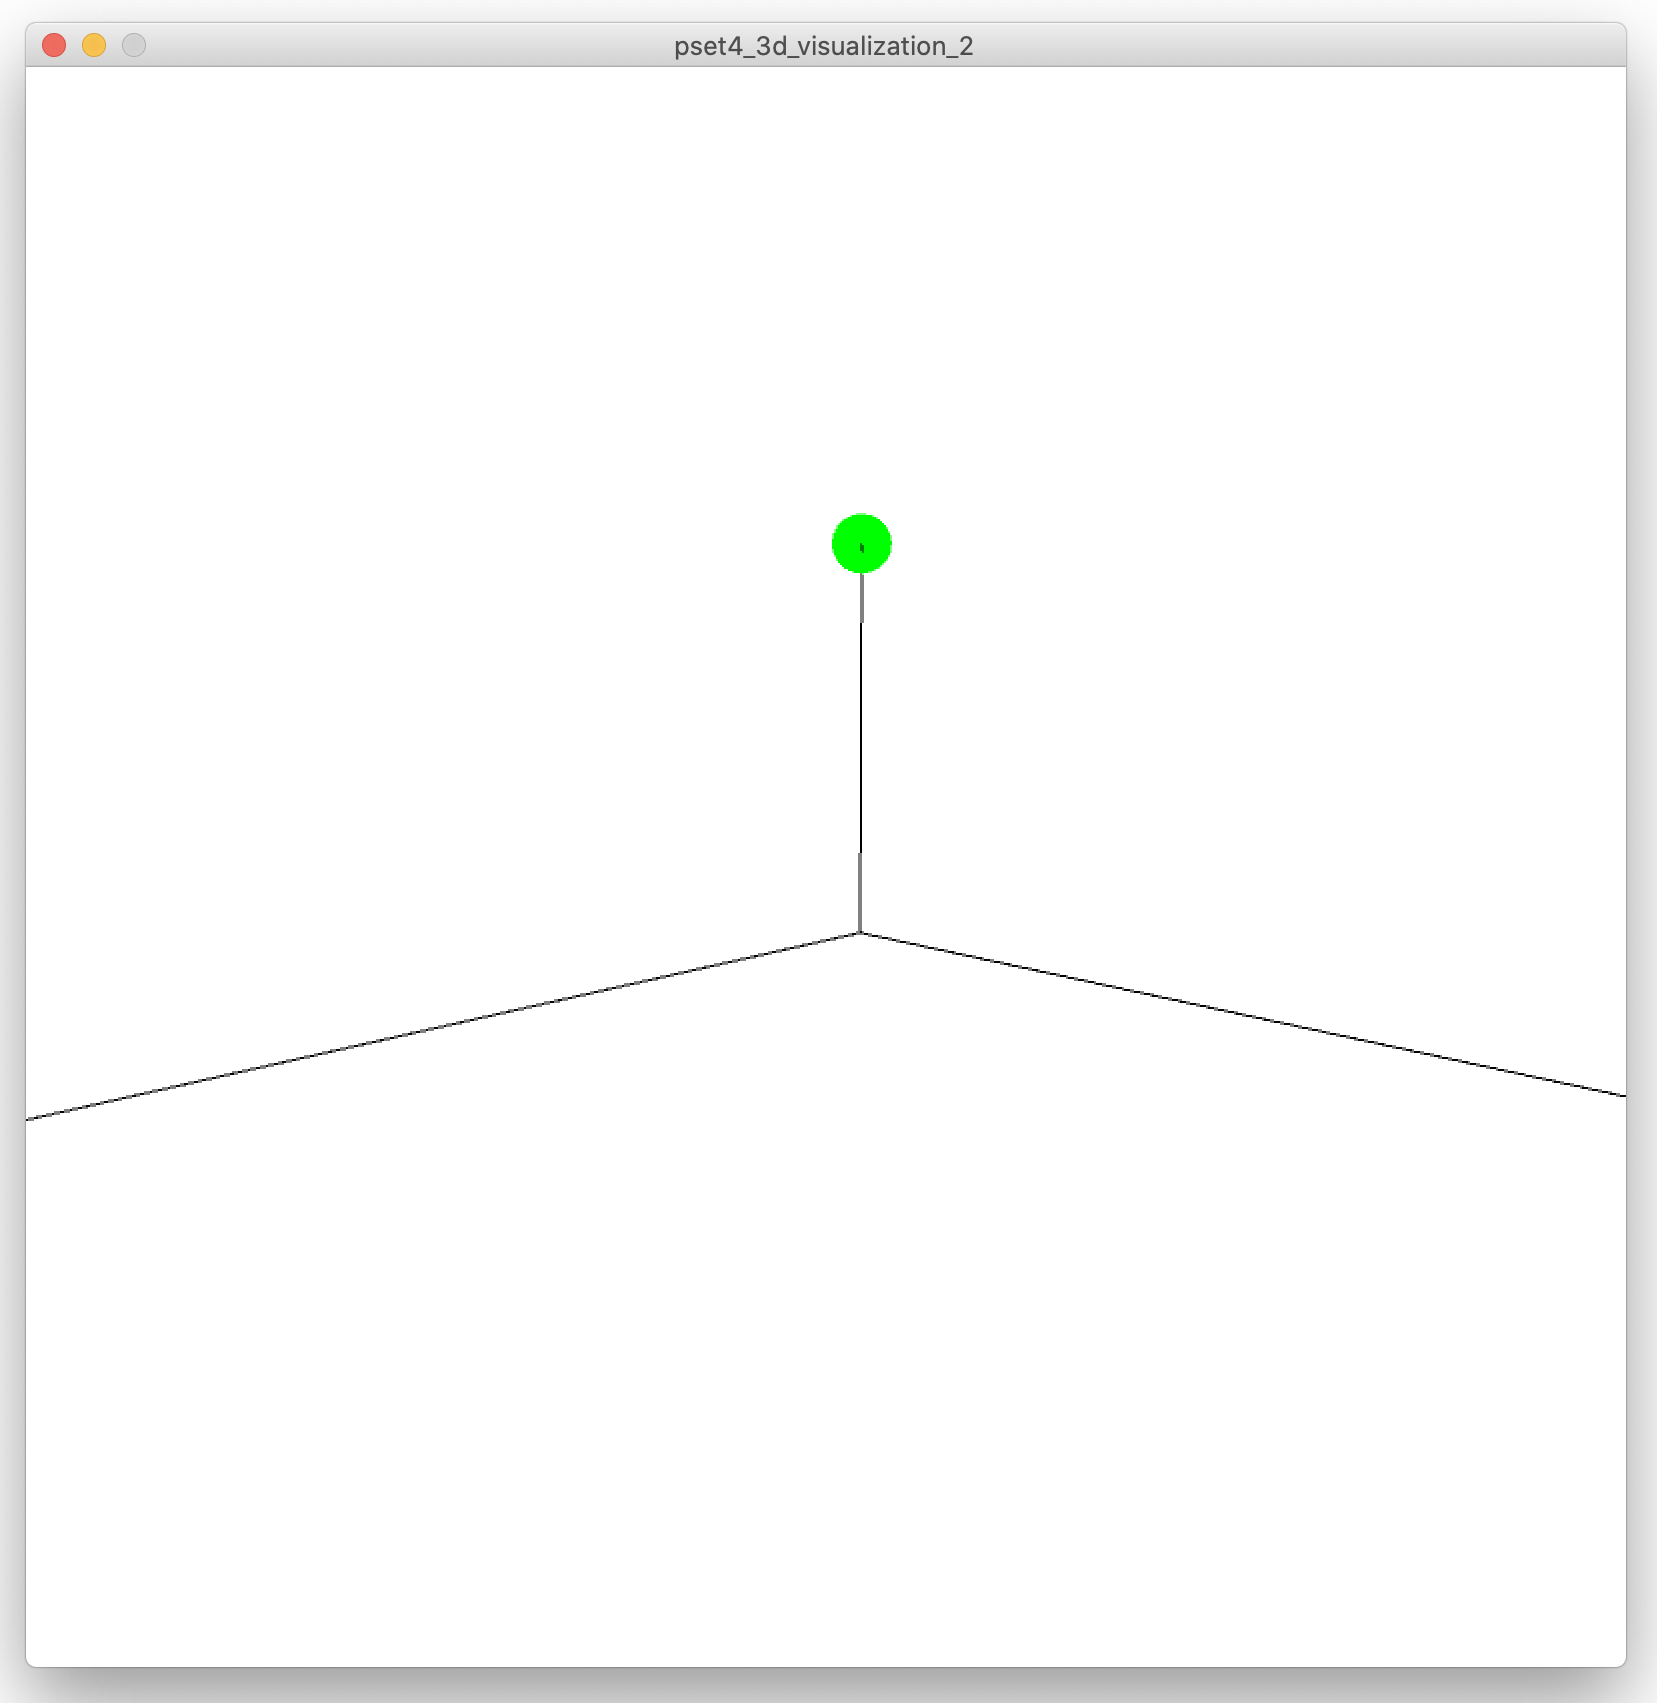
Changing the Camera's Y-Axis Height: To move the camera along the y-axis, you need to change the camera's eye position again, but this time only along the y-axis. Pressing the key 'W' should move the camera up and pressing the key 'S' should move the camera down along the y-axis as shown in the image below.
(3) Draw Touch Pressure into 3D Viewport
Next, you will draw the touch points and associated touch pressure into the 3D visualization based on your interpolated PImage.
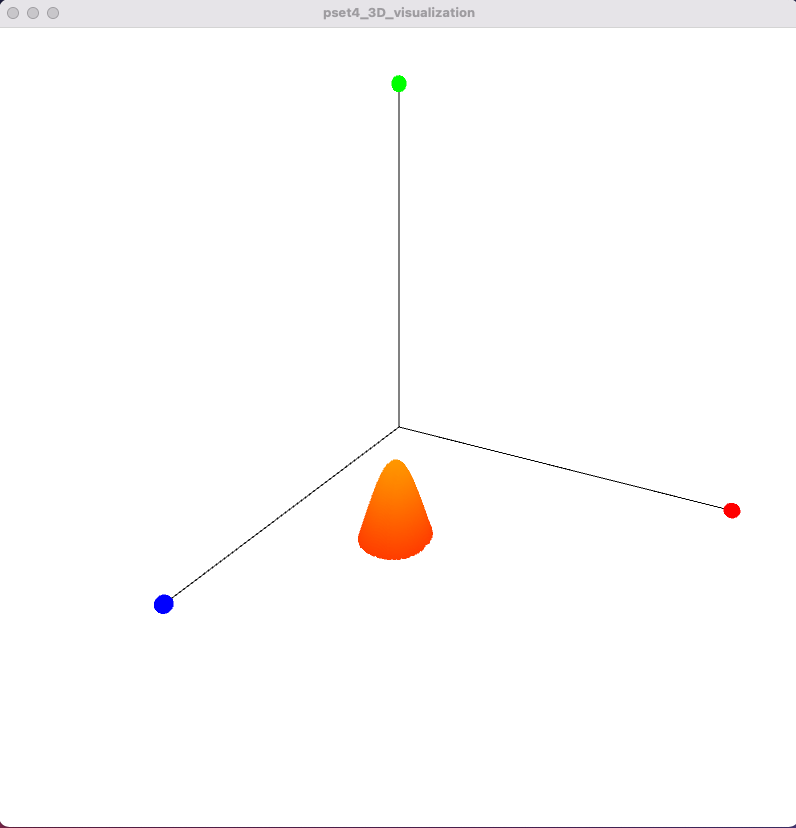
Drawing 3D Points in Processing: To draw the touch points and their pressure, you will create a set of 3D points, where the X,Z coordinates are the row & column number of the pixel on the PImage, and the Y-coordinate is the interpolated value of the pixel. As mentioned previously, the brighter pixels are in an area the more pressure was applied to this area. As a result, the brighter a pixel, the higher the touch bar will be at this point.
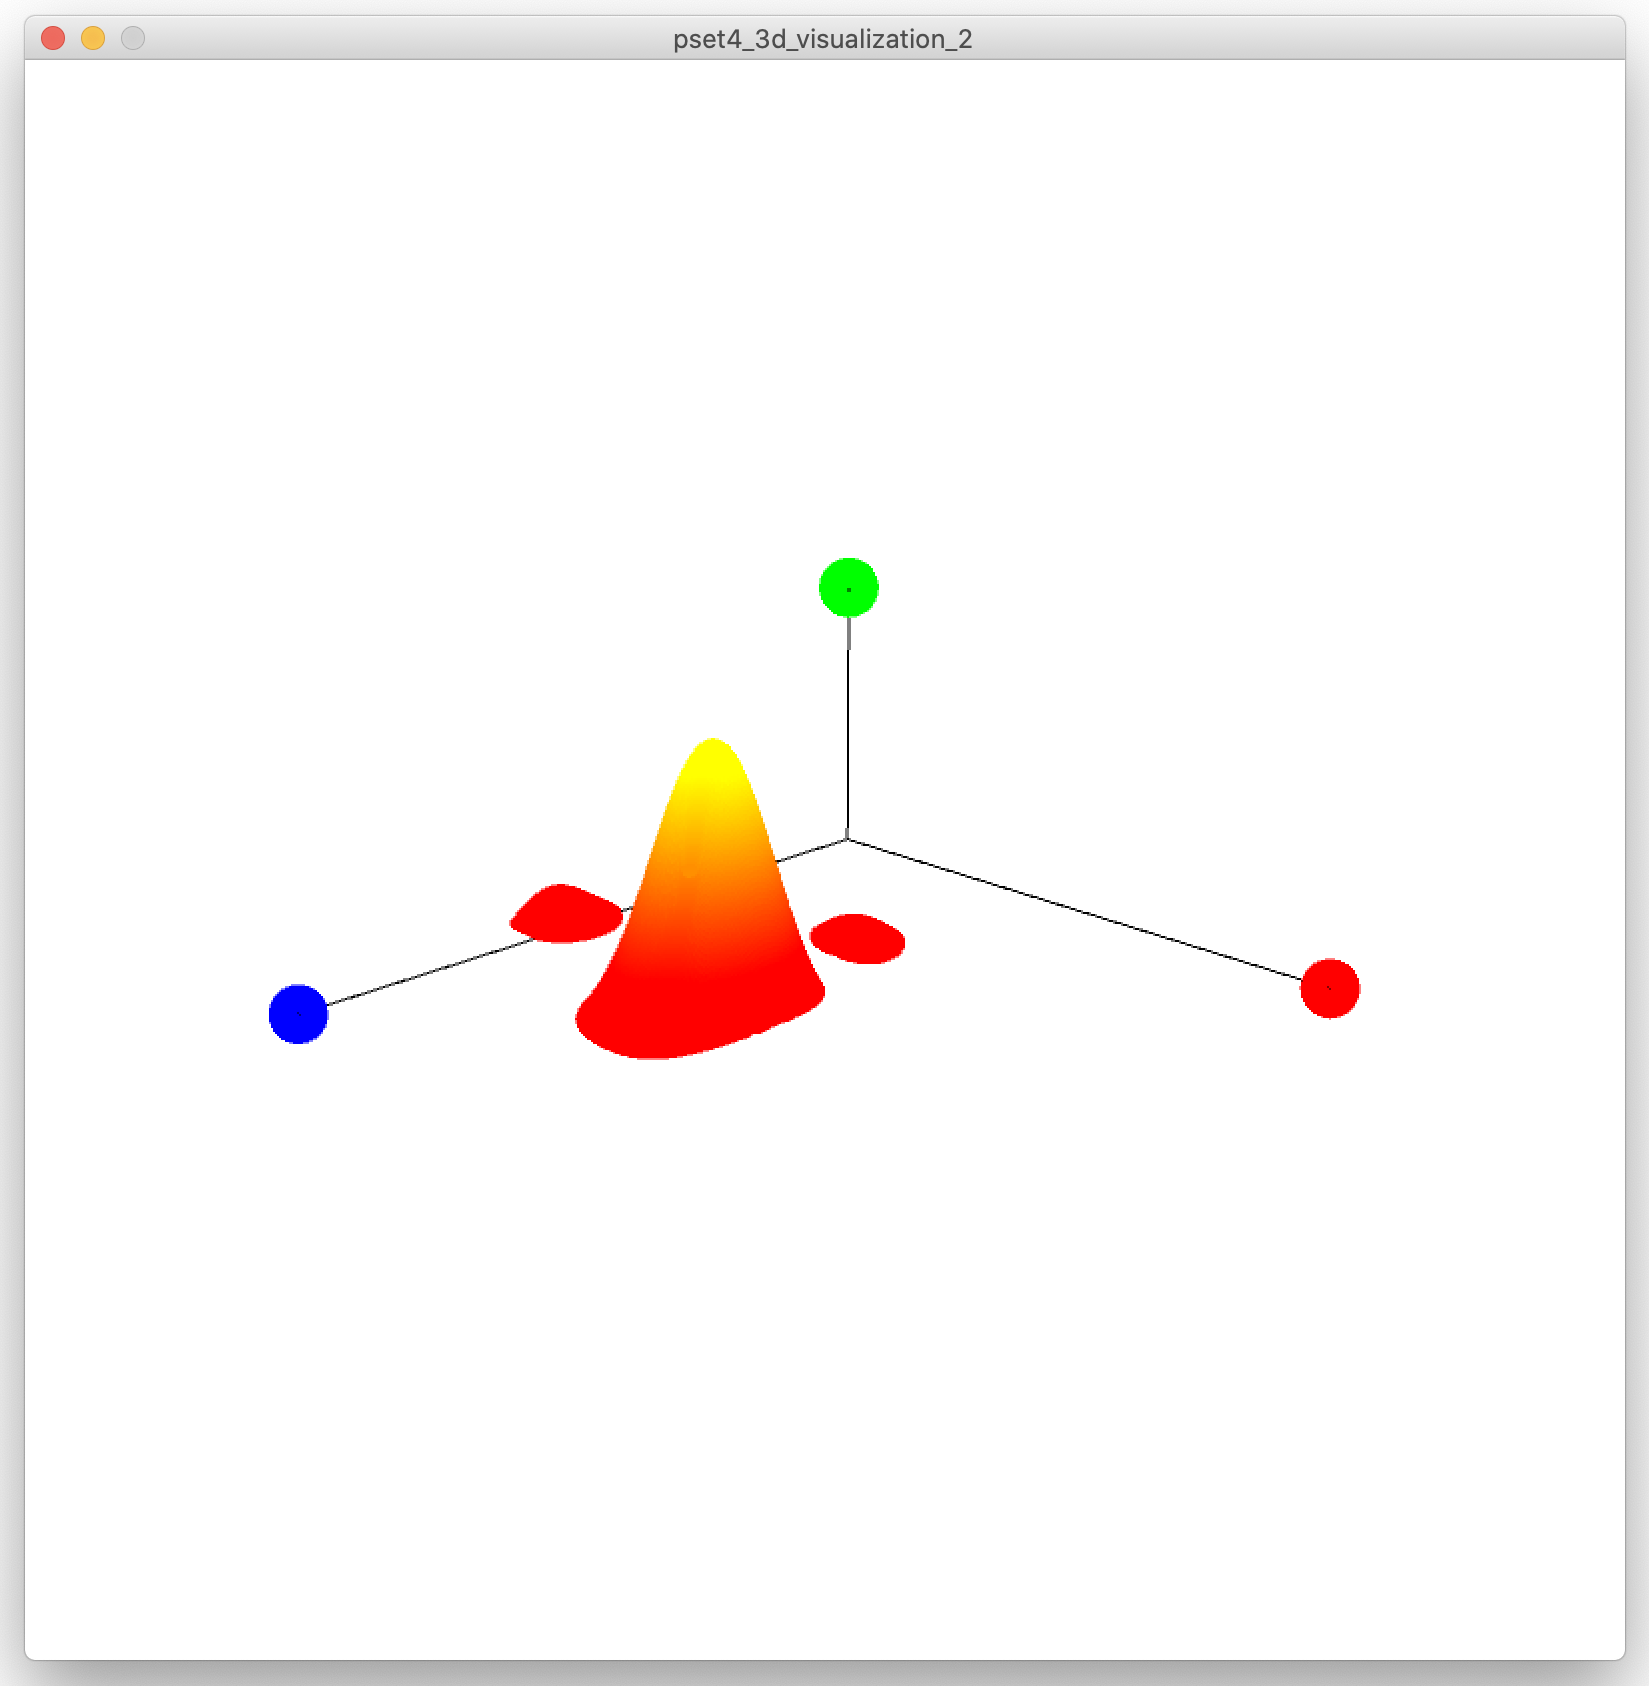
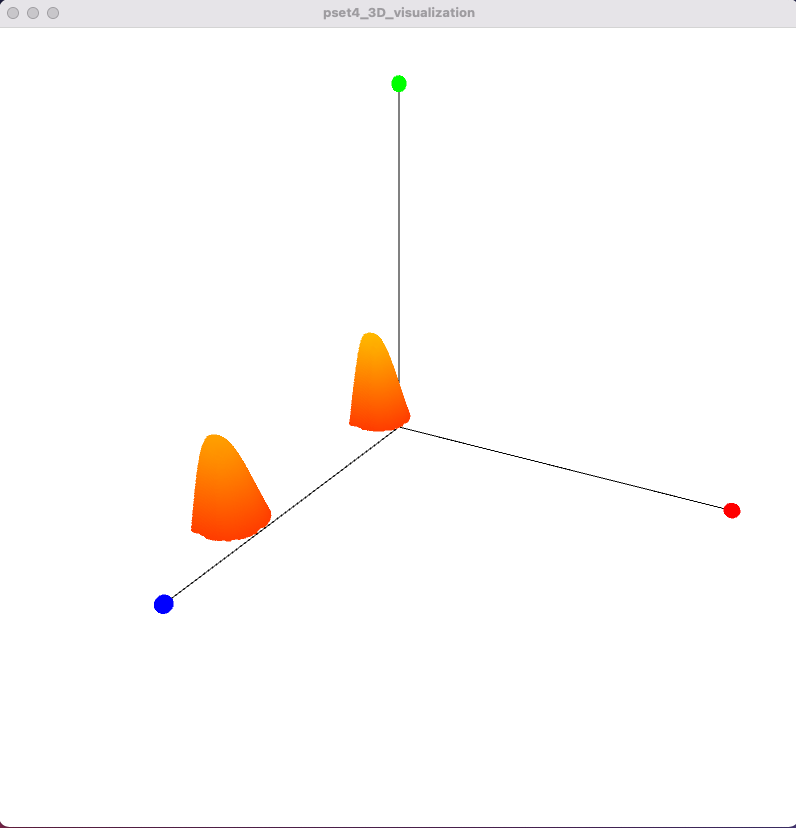
Mapping the Touch Pressure (Y Value) to a Color Gradient: You also need to color the touch bars with a color gradient that represents the "height" (i.e. y-axis coordinate) information. We chose a color gradient of red when only touching with light pressure and yellow when touching with high pressure. You can choose your own color gradient, just make sure that the colors are very different so you can actually see a difference. To implement the y-value to color mapping, you may find it helpful to use the map() function that you already used in the previous psets. The resulting 3D visualization should look like below.
Adjust Signal-to-Grayscale Mapping: If your visualization does not look a nice as below, you may have to adjust your signal-to-grayscale mapping values from pset4 since you are using our pre-recorded data instead if your own multi-touch data. If the mapping is not setup correctly, you may get either only very low values or only very high values rather than a proper touch points. If everything is done correctly, you should see the following pattern for the simulated data:
High touch points:
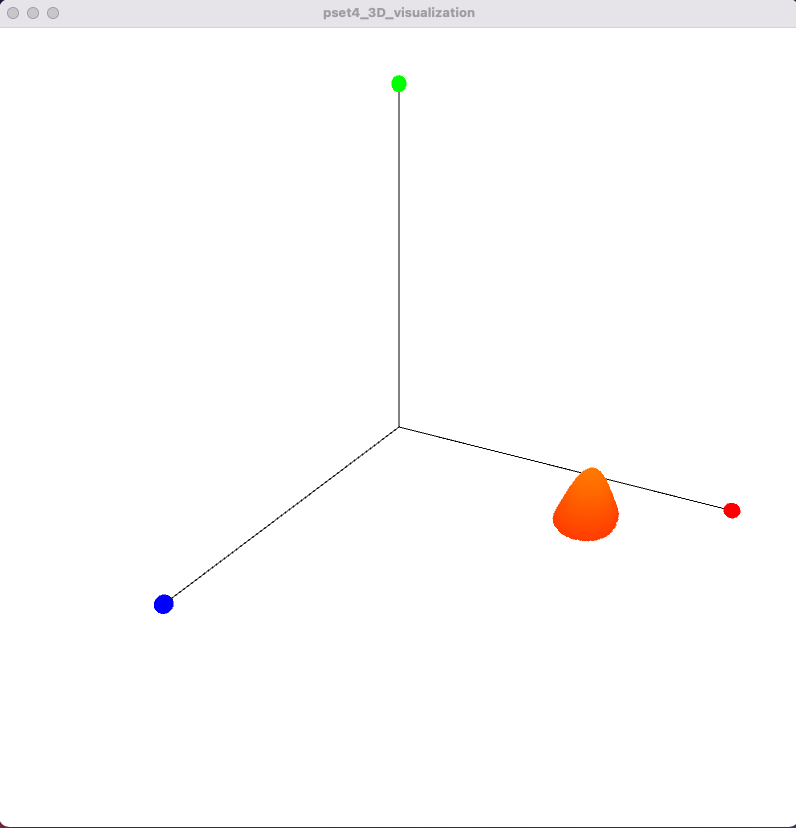
Medium touch points:
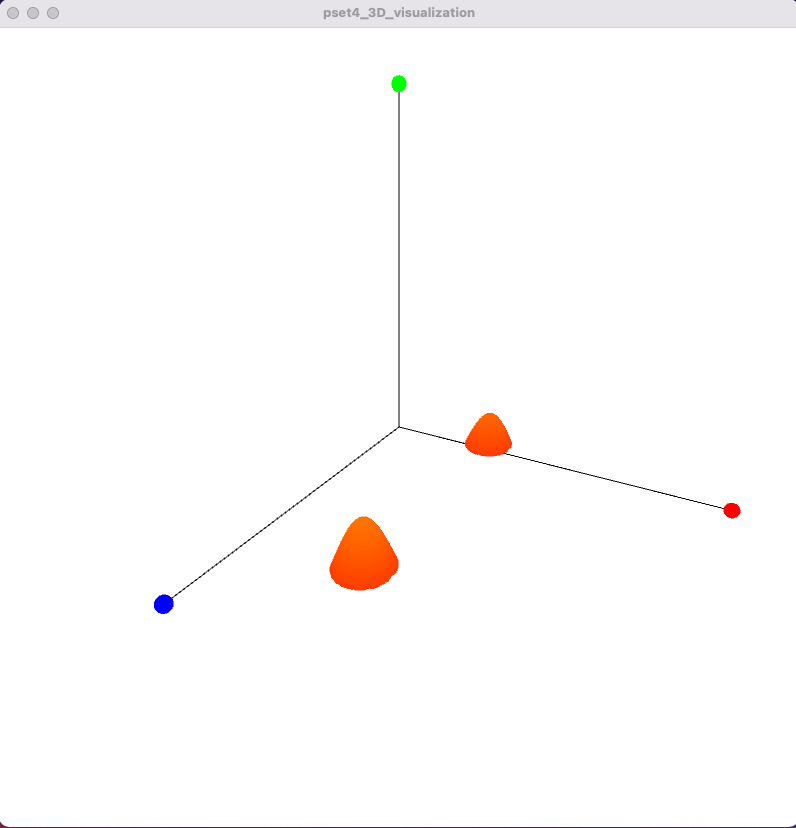
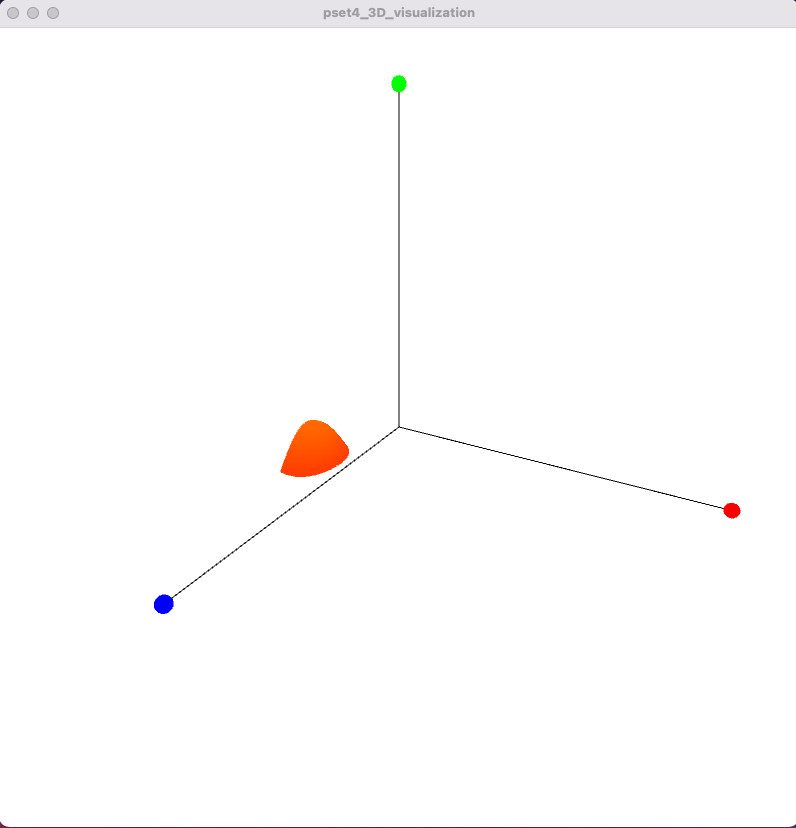
Low touch points:
(4) Visualize Multi-Touch Pad Pressure
So far, you have only used prerecorded multi-touch data to visualize touch pressure. In this last step for drawing touch pressure, you will use your own multi-touch pad and visualize touch pressure for your live touch data.
Connect Multi-Touch Pad and Adjust Signal-to-Grayscale Mapping: To detect touch pressure directly from your multi-touch pad, you don't have to write any additional code. All you need to do is to plug in your multi-touch pad, replace the Arduino code with your own code from pset3, and then adjust the signal-to-grayscale mapping values from pset4 to ensure you get grayscale values as input for your touch pressure visualization that accurately represent the touch point.
Test with Different Pressures (1 finger, 2 fingers): Finally, test your setup by applying different pressure levels to your multi-touch pad with one finger and then with two fingers. Once you see this work you are ready to record the video for the deliverable.
(5) Learn about $1 Unistroke Gesture Recognizer
You can already recognize where the user is touching, which now allows you to implement gesture recognition. A gesture is a series of touch points that execute a specific function. For instance, if the gesture is swiping from left to right, your code should recognize that the user made this gesture and if the gesture is a drawn 'A' your code should know that an 'A' was drawn.
Work with the Mouse First:
You will implement the gesture recognition first with the mouse. Only in the last step, you will also try to make it work with your multi-touch pad. For this last step, you will need a working blob detection.
$1 Unistroke Gesture Recognizer: Luckily, you don't have to implement the gesture recognizer from scratch. Instead, you can use the $1 Unistroke Recognizer, which is available as a Processing library. The $1 Unistroke Gesture Recognizer is part of the so-called $1 Gesture Recognizer family, i.e. a set of different gesture recognizers with different capabilities, such as single stroke gesture recognition, multi-stroke gesture recognition etc. In this pset, we are going to use the $1 Unistroke Recognizer since it is the only one that is available for Processing as a library.
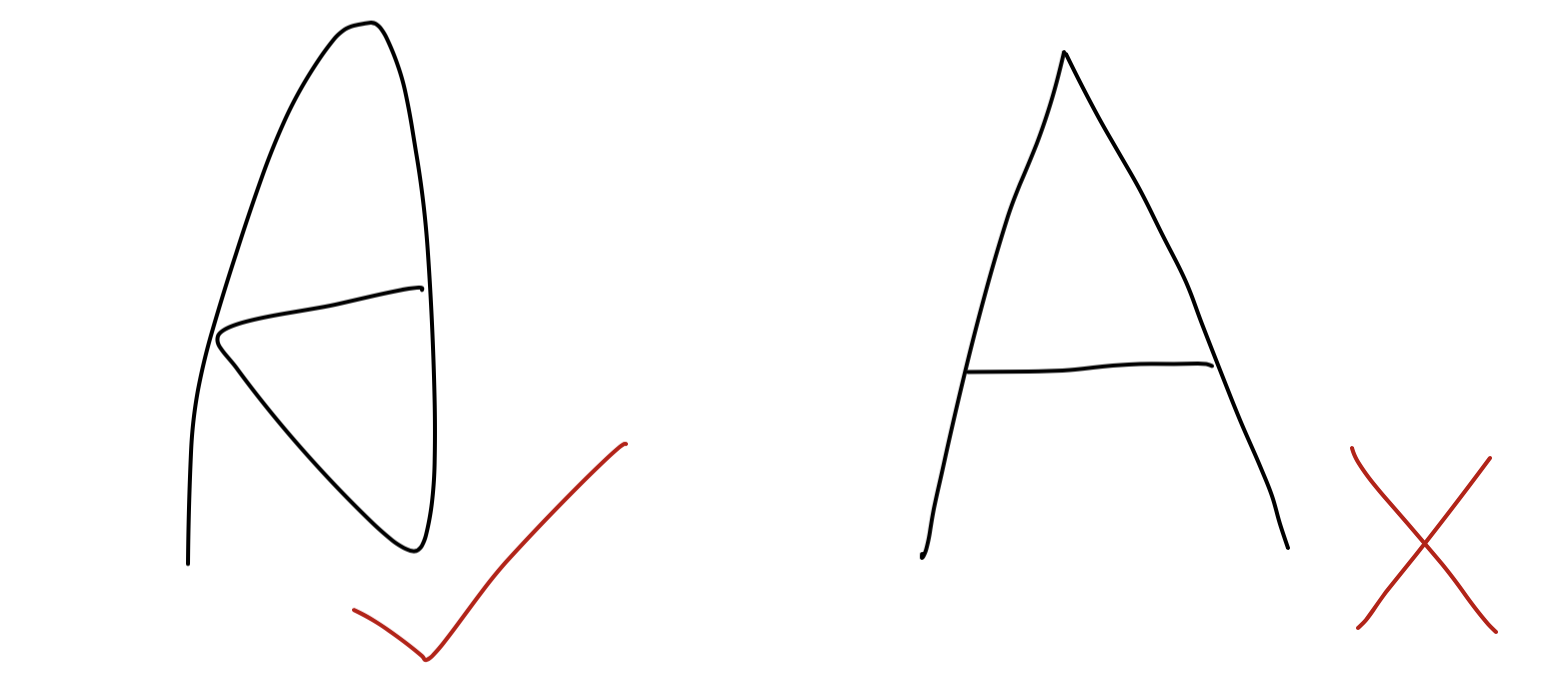
Gestures the $1 Unistroke Recognizer can detect: Unistroke means that the gesture recognizer can only recognize gestures that are made by one finger in one continous stroke. For instance, consider the 2 gestures shown below designed for the letter "A". The left one is written in one continous stroke and thus can be recognized by the $1 Unistroke recognizer. The right one, however, is written in two separate strokes and thus cannot be recognized. Similarly, you can recognize a single finger swipe left/right gesture but you cannot recognize a zoom gesture with two fingers since that would require combining two separate strokes into one gesture. The $1 family also has a multi-stroke recognizer but as mentioned previously it is not available as a library for Processing.
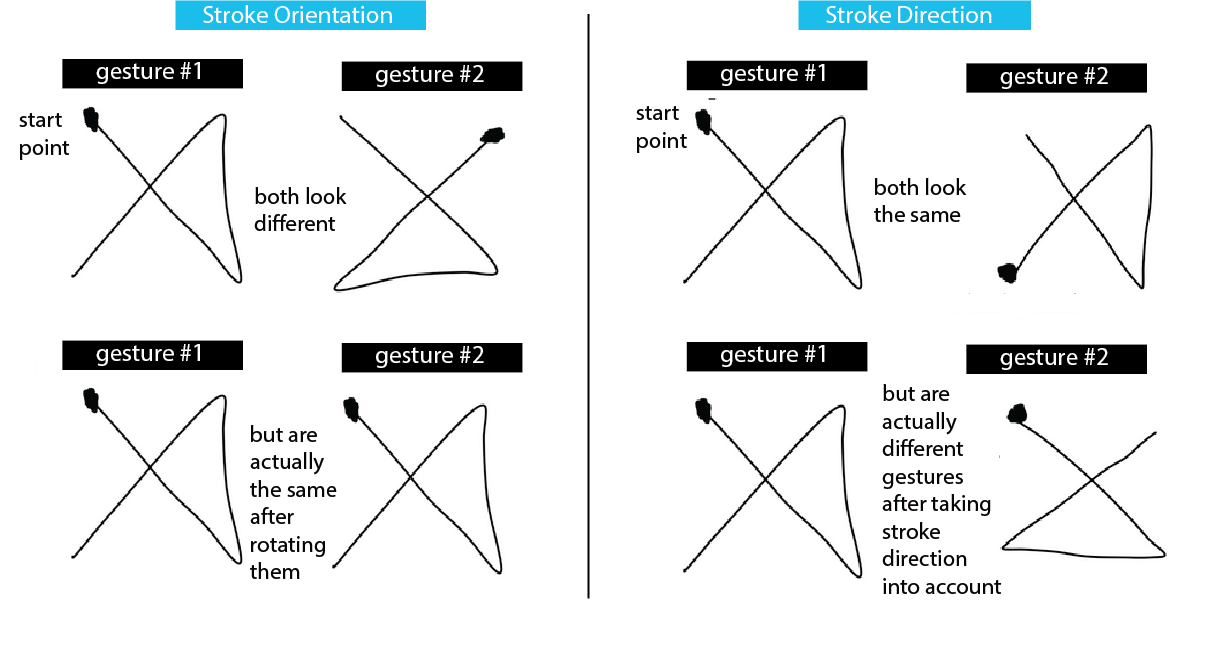
Stroke Orientation: The gesture recognizer ignores the stroke orientation. Consider the example below on the left, which shows the same gesture but executed in different orientations on the multi-touch pad. The gesture recognizer automatically compensates for the change in orientation and will detect that both of the gestures are the same.
Stroke Direction: While the recognizer ignores stroke orientation, it considers stroke direction, which corresponds to the vector direction of the line along which your finger moves. For example, the two gestures shown below on the right are visually identical but in the first gesture we start on the top left, while in the second gesture we start on the bottom left. Therefore, although visually the same gesture, the $1 recognizer is able to distinguish them as two different gestures.
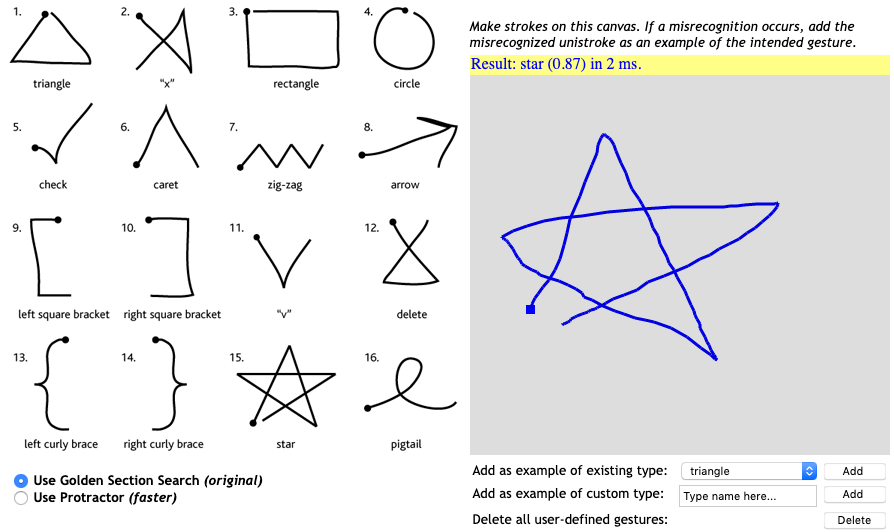
Try the Gesture Recognizer for yourself on the Demo Webpage: Before you move on, try out the interactive demo of the $1 Unistroke Recognizer that you can find here on this website. Scroll down to the Demo section and you see 16 different gestures you can draw into the gray window on the right side. Draw each of the gestures once to get a feel for how different gestures are designed and how well they can be classified. After you drew a gesture, you will see its classified name at the top of the window. You can also make your own gesture by first drawing your custom gesture into the gray drawing window and then giving it a name in the Add as example of custom type: field, then click Add. If you now draw your custom gesture again, it should be correctly classified.
(6) Train Gesture and Connect to Call-Back Function
Now that you know a bit more about what the $1 Unistroke recognizer can and cannot do, you can move on to use the recognizer to detect gestures.
Import $1 Unistroke Recognizer Library into Processing: Start by importing the '$1 Unistroke Recognizer' library by going to Sketch -> Import Library and finding it through the search bar. Next, import the $1 Unistroke Recognizer library into your Pset Processing code.
import de.voidplus.dollar.*;
Instantiate new Gesture Recognizer: Construct a new object of the one dollar recognizer with:
OneDollar oneDollar = new OneDollar(this);
Turn on Console Plotting: Turn on console plotting for the gesture recognizer using the line below. Later, when you make your gestures, the gesture recognizer will immediately print the name of the gesture on the console and also provide how similar it is to the closest match from the recorded template gestures (e.g. 84% similar).
oneDollar.setVerbose(true); // activates console plotting
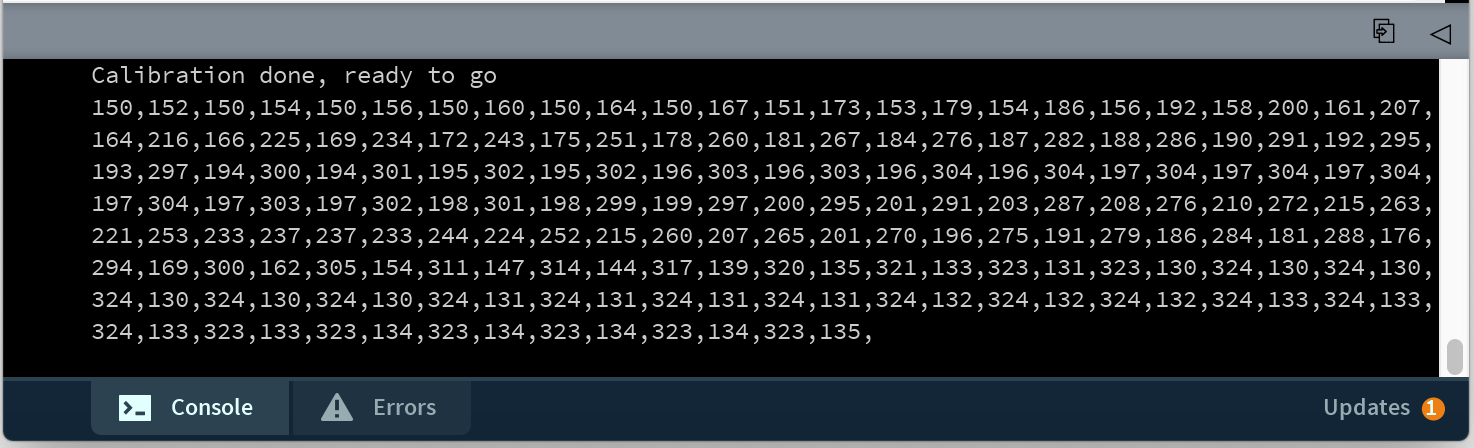
Record Training Data (x/y coordinates) for New Gesture: Before we can train the gesture recognizer to recognize a new gesture, we first have to capture training data, i.e. a series of x-y coordinates that represent the gesture. For starters, we will collect training data for a 'V' gesture, which is one of the most reliable ones that can be detected. While you could obtain the x-y-coordinates for your gesture template by tracking finger input from your multi-touch pad, we recommend that for starters you draw the gesture with the mouse on screen and record the x-y coordinates from the mouseDragged() event. Below you see a recording of all the coordinates for our 'V' gesture.
Train New Gesture Based on Training Data: Next, use the pre-recorded training data to feed it into the learn() function to add the new gesture. You can see the input format for the array below.
oneDollar.learn(String gesture-name, int[] x-y-coordinates); // {x1, y1, x2, y2, x3, y3, x4, y4, ...}
Adding a Call-Back Function to your Gesture: Now that you have added your custom 'V' gesture to the gesture recognizer, you next have to define which function should be called when the gesture is being detected. Such a function is called a callback function and it will be triggered every time the algorithm detects the corresponding gesture. You can bind a gesture to a callback function via the command below. Note that the parameter callback-function-name is the name of the function without parenthesis and parameters. For now just create the functions and we will add the rest later.
oneDollar.bind(String gesture-name, String callback-function-name);
Implement the Callback Function: Next, you need to implement the callback function. The callback function has to have the format shown below, i.e. contain the same number of parameters and parameter types and return void. The function name and parameter names, however, are up to you. If upon recognizing the gesture, you just want to execute some action, you can simply add that code into the function body. If you want to build a location dependent gesture, you can also check where on the multi-touch pad the gesture started or ended using the coordinates provided by the callback function. For now, we just want to print out the name of the gesture whenever it is recognized.
void foo(String gesture-name, float percentOfSimilarity, int startX, int startY, int centroidX, int centroidY, int endX, int endY){
	// do something when the gesture is detected
 }
Useful note: While we have little control of when oneDollar will trigger its callback for a recognized gesture, we can choose when to display it; we can flag that a gesture was recognized then check the flag later. The oneDollar class also has a number of useful methods to help with creating a reliable system. For instance, setMinSimilarity allows you to set the minimum similarity threshold a candidate pattern must meet to trigger the callback. This will prevent oneDollar from randomly guessing. We found that a reliability of 90% works nicely when using the mouse, but a lower value may be preferred when using the multitouch pad. Other methods like setMaxTime, setMinLength, and setRotationAngle are useful but not necessary for our current application.
(7) Track and Visualize Gestures
Now that you have defined how your gesture looks like and what function should be called when it is detected, you still have to tell your code when it should start looking for the gesture.
Start tracking when Mouse Dragging Detected: Since we are still using the mouse for testing, you can start tracking whenever your code detects that the mouseDragged() event started.
oneDollar.track(int x-coordinate, int y-coordinate);
Note that you don't have to 'stop' tracking. The track() function will only be executed when Processing detects a mouseDragged() event. Once it received a mouse coordinate, it will keep looking for follow-up mouse coordinates for a while, and if no more mouse coordinates have been present for some time, i.e. no new data is fed to the gesture recognizer, the recognizer will automatically determine that the gesture has ended and will provide its best guess at what gesture was executed.
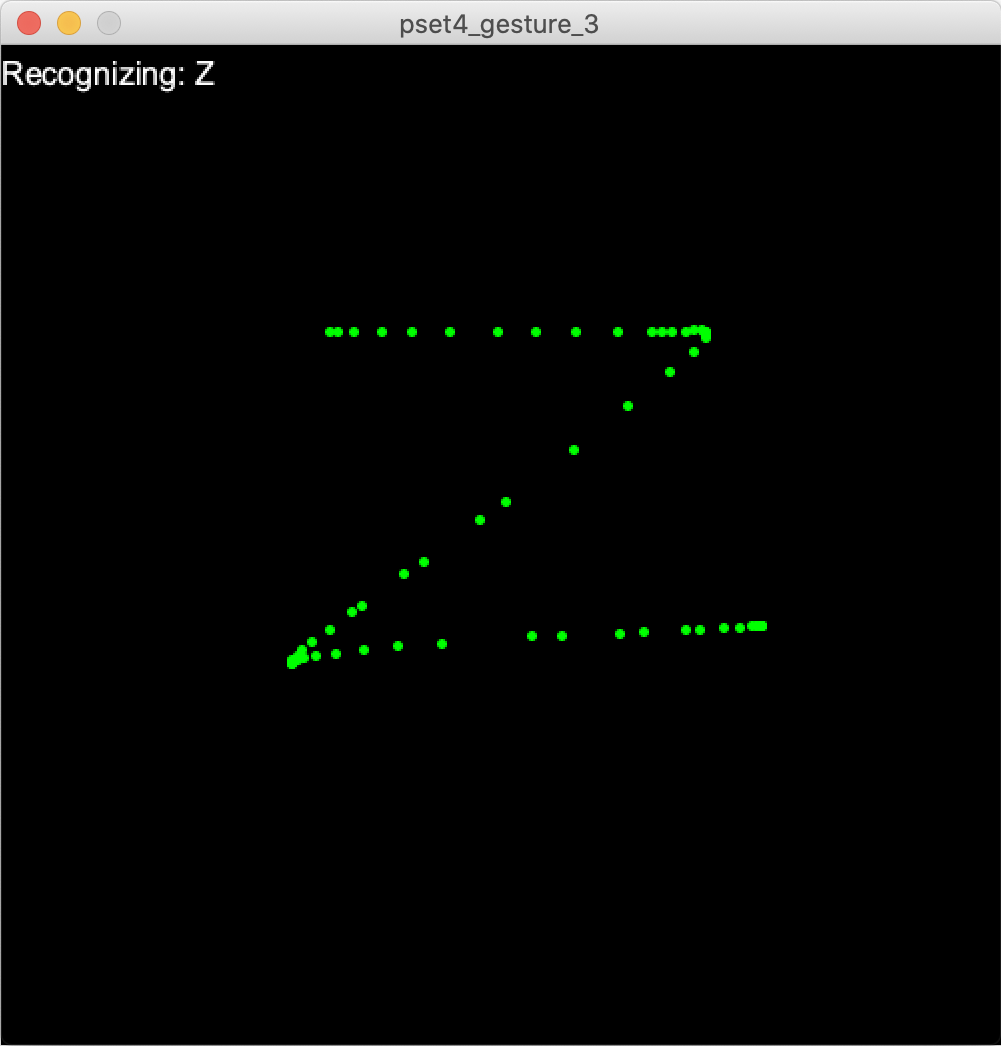
Visualize Gesture Detection Result: Finally, once your gesture is detected, your callback function should visualize the detected gesture. Write the name of the detected gesture into the Processing UI window as shown in the top left corner of the images below and also draw the mouse coordinates into the window. The mouse coordinates should be visible in the window for a while (e.g., show them for another 2 seconds before removing them from the window). You can implement this by storing the mouse coordinates in a separate array. Draw the array points when the array is not empty, and clear the points in the array whenever 2 seconds have passed after the gesture was recognized (use the millis() and System.nanoTime() functions for this). The image down below shows an example of the UI when the "Z" gesture is recognized.
Add Two More Gestures: Next, let's record two more gestures of your choice. Reliable gestures are gestures that have some unique features, such as triangle, zigzag, and checkmark, but you can choose whatever you like. Harder to recognize gestures have smooth outlines which are easily susceptible to noise, e.g. a circle is one of the harder gestures to recognize. Repeat all steps above, i.e. record training data for your gestures, input the training data to the gesture recognizer, connect a callback function, and implement the callback function so that it draws the gesture on the screen.
(8) Implement Finger Gestures on Multi-Touch Pad
Now that you implemented your gestures via mouse dragging, the final step is to also make this gesture recognition work on your multi-touch pad.
Training Data for Gestures: You may be wondering if you should re-record your training data and now use training data directly from your multi-touch pad to feed into the oneDollar.learn() function. For now, we recommend you keep your mouse training data and do not re-record the training data with the multi-touch pad. The reason for this is that the drawing with the mouse will give you clear tracking points for creating your template gesture. When you then later on draw the gesture with your multi-touch pad during actual use, this will often be more fault resistant. In contrast, if you record your template gesture on the multi-touch pad, you will already have some noise in the data and it will be harder to match a gesture when there is additional noise during actual use later on. However, there is also the drawback that the mouse training data may be too clean and a better match may be achieved by matching noisy training data from the multi-touch pad with noisy data during actual use. If you don't get good results with the mouse training data, consider recording training data with the multi-touch pad.
Start tracking when Finger Blob Detected: So far, you started tracking with the oneDollar.track() function when the mouseDragged() event occured. Now you need to change this to start tracking gestures when your code detects a finger blob. Therefore, you need to add the tracking function below in the blob detection method where it determines if a finger was successfully detected. The x/y coordinate in the function are the x/y coordinate of your touch point. Similar to before, you don't have to 'stop' tracking. The track() function will only be executed when Processing goes through its loop and detects a finger blob. Once it saw a finger blob it will keep looking for follow-up blobs for a while, and if no finger has been present for some time, i.e. no new data is fed to the gesture recognizer, the recognizer will automatically determine that the gesture has ended and will provide its best guess at what gesture was executed.
Visualize Gesture Detection Result: In this last step, you need to change your visualization to draw the touch center points into the window instead of mouse coordinates (discard the blob contour).
Test your Gestures on the Multi-Touch Pad: Now that you have the code ready, draw each of your finger gestures on your multi-touch pad and see if they are being recognized. If you don't get good results, first make sure that your blob detection is still detecting the finger on the multi-touch pad. If you changed your setup since last time, you may have to adjust the signal-to-grayscale mapping and the blob detection threshold (see pset4) to make sure your finger blobs are detected. Without properly detected finger blobs, the gesture recognizer will not have reliable input data and thus will have trouble recognizing the gestures. Once you are able to execute your three gestures and have them recognized, you are ready to record the video for the deliverable.
Deliverables
For grading, please upload the following to your google drive student folder:
Touch Pressure
- the .pde file of your Processing program
- a short video captured with either your phone or a screencast showing the pre-recorded touch data pressure visualized in the Processing UI (.mov or .mp4, no more than 20MB)
- a short video showing the touch pressure visualization with live data from your multi-touch pad for 1 finger and 2 fingers touching (take the video so that the multi-touch pad and Processing Window are seen at the same time) (.mov or .mp4, no more than 20MB)
Gesture Recognizer
- a drawing on paper that shows your 3 custom finger gestures so we know which gestures you implemented, use the same notation as in the pset to indicate the start point for executing the gesture
- the .pde file of your Processing program
- a short video showing the mouse gestures, i.e. your Processing UI successfully recognizing the 3 different gestures you drew with the mouse (take the video so that your mouse/trackpad and Processing Window are seen at the same time) (.mov or .mp4, no more than 20MB)
- a short video showing the multi-touch pad gesture recognition, i.e. your Processing UI successfully recognizing the 3 different finger gestures (take the video so that the multi-touch pad and Processing Window are seen at the same time) (.mov or .mp4, no more than 20MB)
Grading
We will give 20 pts in total:
Touch Pressure (10pts)
- 5pts: (prerecorded data) you implemented the 3D viewport and camera motion, i.e. the axis are all drawn correctly and color coded, the user can zoom in/out, rotate around the scene, and change the camera's position to look from the scene from above or below.
- 3pts: (prerecorded data) you drew the touch points and their pressure values into the 3D viewport and assigned a color gradient depending on the pressure value
- 2pts: (live data) you showed that it works with live data from your multi-touch pad when one or two fingers are touching
Gesture Recognizer (10pts)
- 5pts: (prerecorded data) you implemented gesture recognition with the mouse, i.e. you recorded mouse training data, trained the gesture recognizer, connected the callback function
- 3pts: (prerecorded data) you implemented the gesture visualization for three different gestures with the mouse
- 2pts: (live data) you implemented gesture recognition also for the multi-touch pad, i.e. you changed your code to use finger blobs instead of mouse data and showed that you can recognize the gestures when they are drawn with the finger on your multi-touch pad.
If your printed multi-touch pad is degrading, let us know and we can give you one that we fabricated to test if it's really the multi-touch pad or something in your circuit/code.
Please let us know if anything was confusing in the write up.
You can add your comments here.
To visualize touch pressure, you do not need to have a working blob detection. All you need is the scaled up image with the grayscale values. We will also work with prerecorded data first, and then only in the last step you will also try to connect your multi-touch pad.
You will implement the gesture recognition first with the mouse. Only in the last step, you will also try to make it work with your multi-touch pad. For this last step, you will need a working blob detection.
import de.voidplus.dollar.*; OneDollar oneDollar = new OneDollar(this);oneDollar.setVerbose(true); // activates console plottingoneDollar.learn(String gesture-name, int[] x-y-coordinates); // {x1, y1, x2, y2, x3, y3, x4, y4, ...} oneDollar.bind(String gesture-name, String callback-function-name); void foo(String gesture-name, float percentOfSimilarity, int startX, int startY, int centroidX, int centroidY, int endX, int endY){
// do something when the gesture is detected
}setMinSimilarity allows you to set the minimum similarity threshold a candidate pattern must meet to trigger the callback. This will prevent oneDollar from randomly guessing. We found that a reliability of 90% works nicely when using the mouse, but a lower value may be preferred when using the multitouch pad. Other methods like setMaxTime, setMinLength, and setRotationAngle are useful but not necessary for our current application.oneDollar.track(int x-coordinate, int y-coordinate);