6.810 Engineering Interactive Technologies (fall 2021)
Pset4: Visualizing Multi-Touch Input
In this problem set, you will write Processing code that takes as input the sensor signals and visualizes the resulting touch points as white pixels in a grayscale 2D image.
Steps:
- Download Skeleton Code and Install Libraries
- Read Multi-Touch Sensing Data into Processing
- Reducing Noise in Received Signal
- Convert Received Signals into Grayscale Values
- Scale Up Image Using Bicubic Interpolation
- Blob Detection
- Use Your Own Multi-touch Pad Data
Help us Improve Class Materials for PSet4:
Please let us know if anything was confusing in the write up or if you had trouble with the test program.
You can add your comments here.
Please let us know if anything was confusing in the write up or if you had trouble with the test program.
You can add your comments here.
Get a new multi-touch pad from a TA:
If you have the feeling your printed multi-touch pad is degrading, let us know and we can give you one that we fabricated to test if it's really the multi-touch pad or something in your circuit/code.
If you have the feeling your printed multi-touch pad is degrading, let us know and we can give you one that we fabricated to test if it's really the multi-touch pad or something in your circuit/code.
Ask a TA to give you Arduino signal code if you did not finish pset3 (only needed for the very last step of pset4):
In case you did not finish pset3, you can ask a TA to provide you with a piece of Arduino code that will simulate sending touch data.
In case you did not finish pset3, you can ask a TA to provide you with a piece of Arduino code that will simulate sending touch data.
(1) Download Skeleton Code and Install Libraries
Download Skeleton Code: Start by downloading the skeleton code for the pset4 from here.Install Libraries: Before you can execute the skeleton code, you first have to install two libraries.
OpenCV library:
OpenCV is a library that helps with image processing. In our case we will draw our touch signals into an image. Below we describe how to install it.Install OpenCV Library in Processing: First, install the library directly in Processing by going to
Sketch/Import Library/Add Library and searching for OpenCV. This version of OpenCV library is for the last version of Processing (3.x), and we need to update it for Processing 4.0.Update OpenCV Library for Processing 4.0: To update OpenCV, go to this link, download the zip file provided, and unzip it. You will find a folder named
opencv_processing. Next, let's find the folder where the Processing libraries are stored on your system. On the top Menu bar, go to Processing > Preferences; here you'll find 'Sketchbook Location'. (If you are on a Mac, it will look like /Users/UserName/Documents/Processing, and on Windows it will look like C:\Users\UserName\Documents\Processing). Browse to this location, and open the folder named libraries. You'll find a folder named opencv_processing, same as the one you have downloaded from the link given above. Replace this folder at this location with the one you have downloaded. Now, your OpenCV version has been updated to work with Processing 4.0. Run Sample Code to Verify OpenCV Installed Properly: Let's run one of the example codes provided with the OpenCV library. Navigate to the top Menu bar in Processing, and go to
File > Examples > Contributed Libraries > OpenCV for Processing > Find Contours. Double click to open the file and run the code. You should be able to see an image in a new window, with contours detected and highlighted. BlobDetection library:
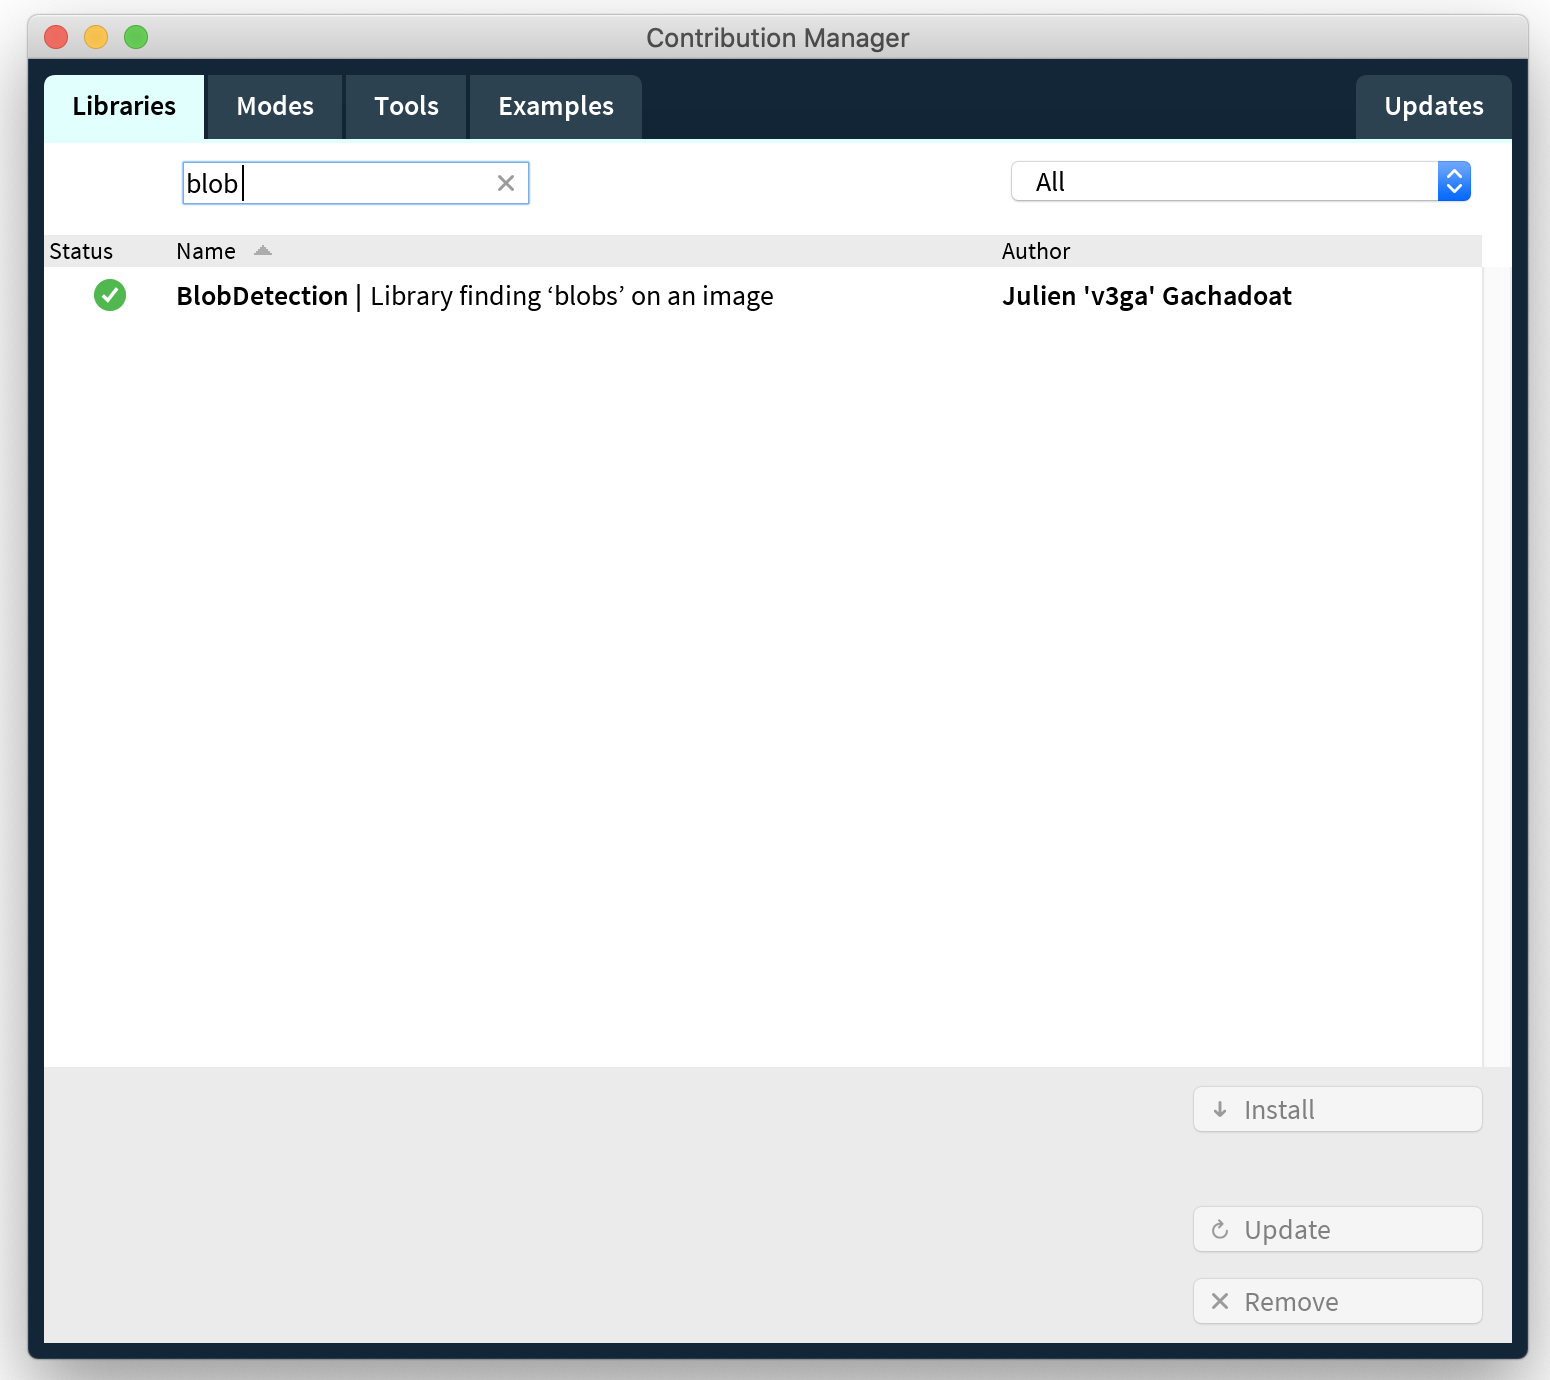
BlobDetection is a library that helps to find blobs inside of images, in our case the blobs are the touch points on the multi-touch pad. We will use this later in pset5. You can install the library directly in Processing by going to: Sketch/Import Library/Add Library and searching for BlobDetection. You will not be using this library in pset4. However, because pset4 & 5 use the same skeleton code, we ask you to install this library now so that the skeleton code can compile without error.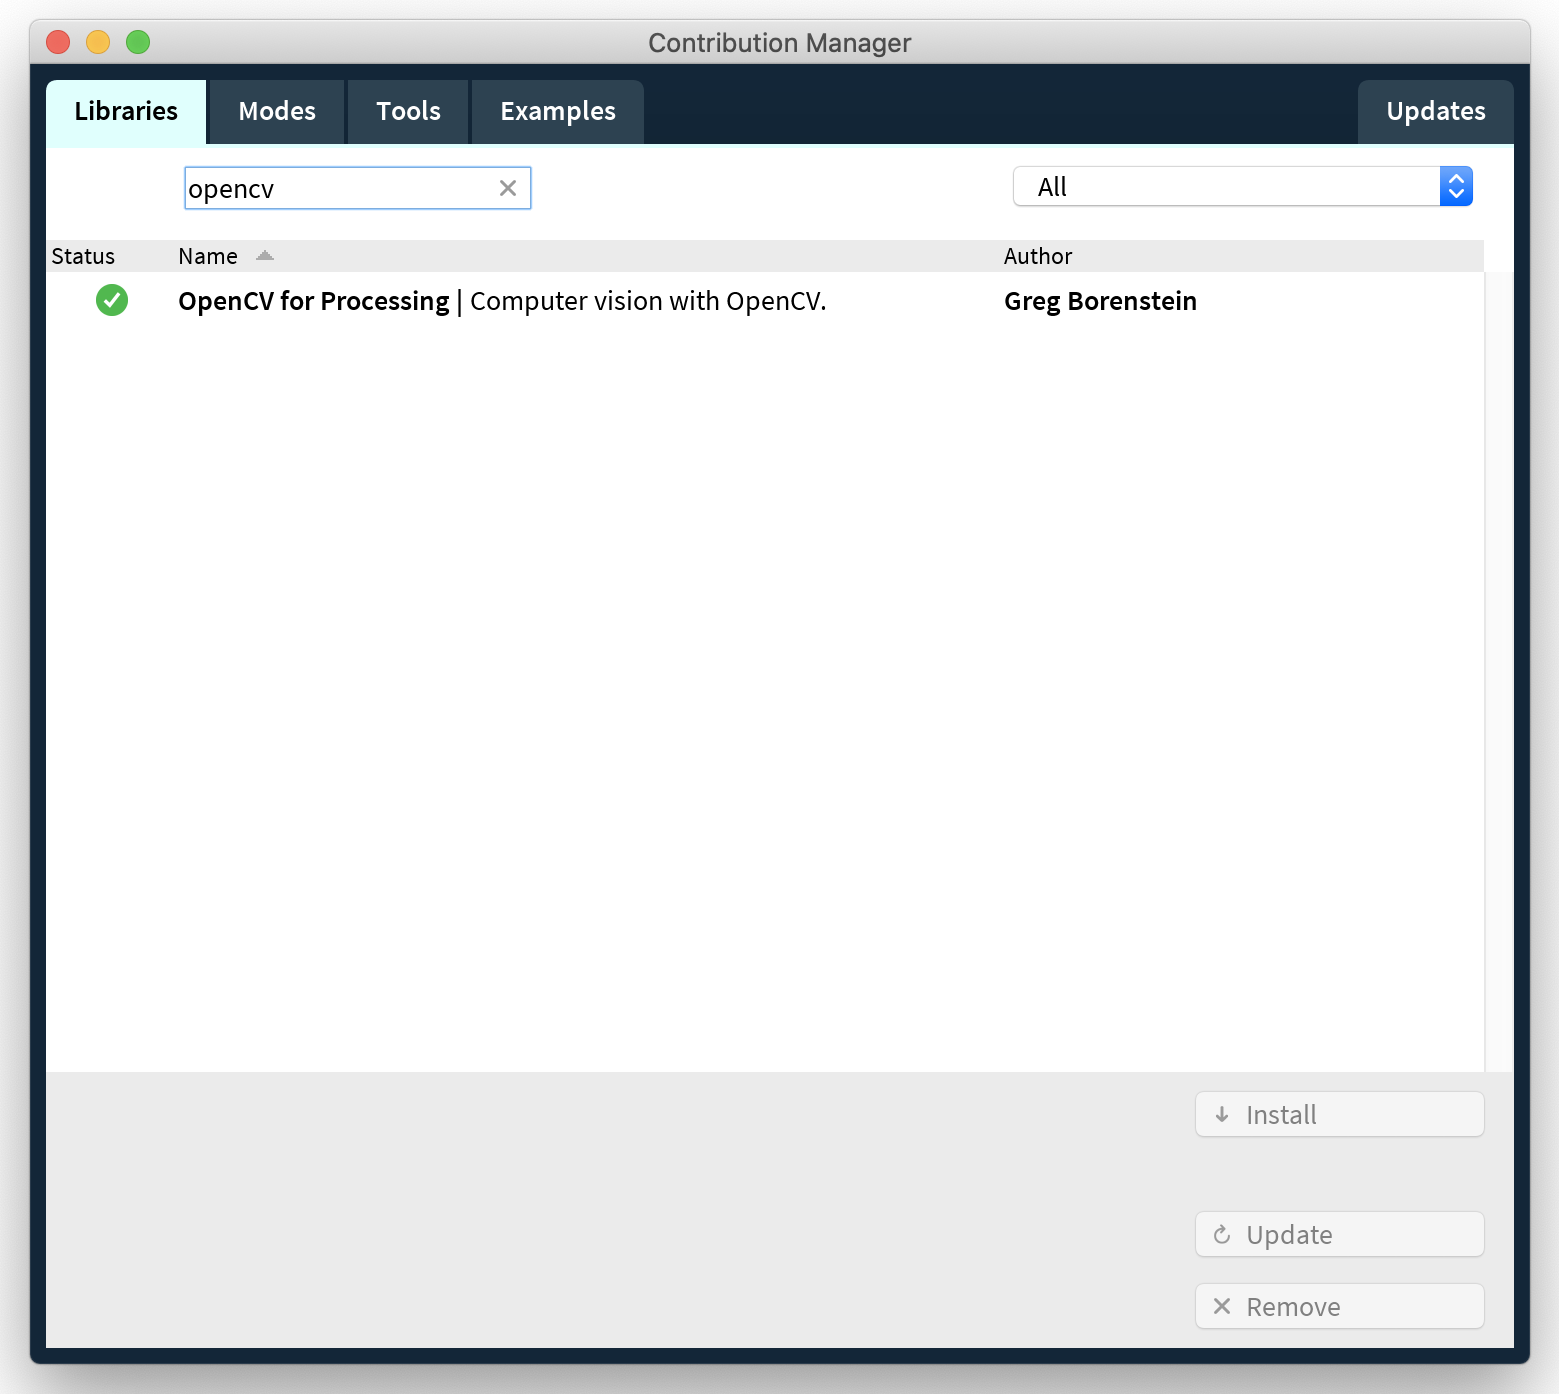
(2) Read Prerecorded Multi-Touch Sensing Data into Processing
To make it easier for you to write the code for pset4, we provide you withprerecorded multi-touch data. This allows you to implement all steps based on the touch data we provide, before testing your code with your own multi-touch pad in the last step of this pset. To implement pset4, all you need to do is to plug in your ESP (you do not need to plug in the rest of the circuit / multi-touch pad until the very last step).Download Arduino Program that Writes Prerecorded Data to the Serial Port: Download the
Arduino program (.ino) from here that will write the prerecorded touch data to the Serial Port. Compile it and upload it to your ESP microcontroller. The prerecorded data contains data for no touch, touch with one finger, and touch with two fingers in the same format as you wrote it to the Serial Port with your Arduino Code in the last pset.Read Data from Serial Port Into Processing: Remember from the last pset that the
touch data is written onto the serial port one line at a time in the format seen below. 0,50,83,58,79,108,75,82,54; //columm0, row0val, row1val, row2val 1,55,92,120,84,63,61,88,53; //columm1, row0val, row1val, row2val 2,61,64,73,66,92,78,67,57; 3,65,117,116,84,48,81,91,71; 4,65,128,116,54,76,81,88,59; 5,61,86,66,54,114,78,64,64; 6,59,86,120,83,85,75,93,63; 7,56,86,116,70,72,83,80,64; 8,23,82,74,68,98,64,62,52; ...
You now need to read this data from the
Serial Port into Processing. We have already shown you how to read data from the Serial Port into Processing in Lab 3 & 4 and you can check your prior code from back then to see how to do it. Put your code for reading the data into the readSerial() function: 
Clean Data when Reading it from the Serial Port into Processing: Although the ESP is writing clean data to the Serial Port, the received data from the Serial Port in Processing can be messy, i.e. sometimes a
data line will be completely missing, and other times there may be unrecognized characters. Make sure your readSerial() function in Processing properly handles these unexpected characters and formats, and stores only the valid data. One way to ensure the validity of the data being read from the serial port in Processing is by checking the number of characters currently written in the serial buffer. Whenever a correct line of data is written through the Serial Port, there are at least 18 characters. Additionally, you may find the Processing string functions useful in parsing your data, you can find documentation here. For instance, you can use the function match() to check whether the string matches a certain regular expression, which is a really powerful tool. Save Data for One Complete Scanning Pass into a 2D Array: The data for a
single pass on all columns and rows should be saved into a 2D array. When considering the size of your 2D array, remember that we build a 8x9 multi-touch pad. Printing the 2D array to the Processing command line should look something like the print out below. Every time a new pass over all columns/rows starts, you need to override your array values. Instead of overriding the whole array at once, update the array row by row whenever there is new data coming from the serial port, i.e. update the row values based on the column number at the beginning of the data. 
(3) Reducing Noise in Received Signal
As you may have noticed, even when your code reads theno touch data (first data that comes in when you upload the Arduino Ino program that we provided), the data always has some value although you would expect that they should receive 0. This is what we call noise in signal processing.Factors that Cause Noise: Noise can be caused by a variety of factors. On the entire multi-touch pad, noise can be caused by the
substrate the multi-touch pad is placed on, i.e. if you place it on a glass table or a wooden table the noise level will be different. Additionally, noise can be different at each of the connection points in the circuit. For instance, each FPC connector and each wire may have different noise levels since the conductive lines all make slightly different levels of contact.
Furthermore, since the inkjet printed circuit may not be perfectly consistent everywhere either because of uneven printing or because of different ageing levels over time, the different printed paths may also have different levels of noise.
Finally, in addition to the reasons above, we can also have different noise levels on a single row of electrodes because the distance between the receiver pin and each electrode in the row is different, thus the electodes further away accumulate noise over a larger distance.
All of these factors together result in different noise levels at each point in your multi-touch pad. Noise is an issue because it can lead to false positives, i.e. your code may think the multi-touch pad was touched although no interaction occured. To prevent this, we need to eliminate the noise in our signals.Eliminate Noise with a Noise Baseline Filter: In order to eliminate the noise and have more "clean" data, we will implement a simple
noise baseline filter. A noise baseline filter works in two steps: (1) a noise baseline signal is recorded when the multi-touch pad is not touched. After this, (2) the noise baseline is subtracted from the incoming signal. Thus, if no touch occured, the resulting values will be zero this time (or very close to it).Record Noise Baseline: Implement the noise baseline in the
setBaseLine() function and change the boolean baseLineSet in the skeleton code to true once the baseline is set. Keep reading below on the steps to accomplish this: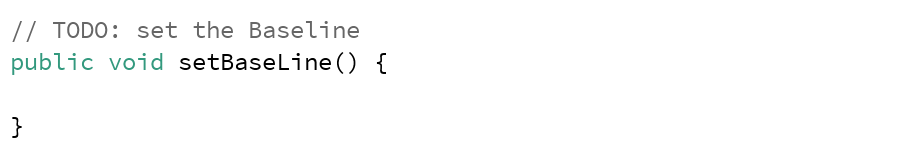
Extract Noise Baseline Data: The
first two seconds in the prerecorded touch data that we provide is data with no touching, i.e., the multi-touch pad is laying on the table with no finger present. We can use this data as our noise baseline. Write code that determines when the data read from Serial Port can be used for the noise baseline (first two seconds) and when the data is actual touch signal data (anything that comes after that). You can use Java's native System.nanoTime() or Processing's millis() funtion (documentation here) to find out how many seconds you already read data. Note that the Arduino code will endlessly loop(), i.e. after sending all the prerecorded touch data once it will start sending it again and again. Thus, every time you restart your Processing code to record the noise baseline, you also need to restart the ESP so that it starts reading the prerecorded data from the beginning again and thus reads the 'no touch' data frst. You can do this by hitting the reset button on the ESP, which restarts the Arduino code. You can make this less hectic by telling Processing to only start the timer when it actually starts receiving data.Average Incoming Noise Baseline Signal in Processing: Once you receive the noise baseline values,
average the values at each position of the multi-touch pad to create the noise baseline value at each position. Yes, you need to record and compute the noise baseline for every position in the multi-touch pad for the reasons mentioned above, i.e. that every position has its own level of noise. Thus, in the end you should have 8x9 = 72 noiseline base values in total, which should be saved in a noise baseline 2D array. You only have to do this once at the beginning (and please only do it once and not again and again in the loop()). Subtract Noise Baseline value from Touch Data: Next, implement the
subtractBaseLine() function in which you subtract the noise baseline from the incoming touch data. If you don't touch the multi-touch pad, the noisy incoming signal minus the noise baseline will equal 0 (or at least be close to it) and thus the chance of false positives is much smaller, i.e. the chance that your code thinks that a touch occured although there was none is greatly reduced. Make sure the cleaned sensing values stored after the subtraction are not negative (if the subtraction result is less than 0, set that value to 0). 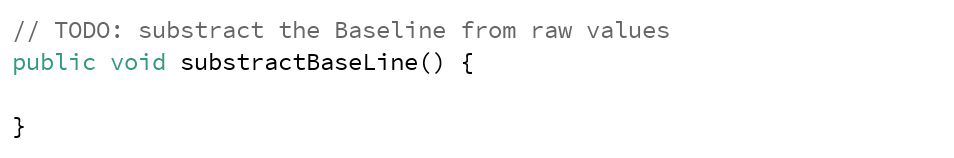
(4) Convert Received Signals into Grayscale Values
Now that we have cleaned sensing values, our next step is to find outwhere the multi-touch pad was touched. While there are multiple different ways to find our where the multi-touch pad was touched, we will use an approach based on image-processing. First, we will convert our 8x9 analog sensor signals into grayscale values and then draw the grayscale values into a 8x9 pixel image. Brighter pixels will correspond to higher sensor signals (i.e. touch points) while darker pixels will correspond to lower sensor signals (i.e., areas that were not touched). Since image processing on such a small 8x9 pixel image is too difficult, we will then increase the size of the image to 500x500px using bicubic interpolation to fill in for the missing pixel values. We can then use blob detection to extract the white blobs in the image (i.e. the touch points) and get the touch coordinates from the blobs.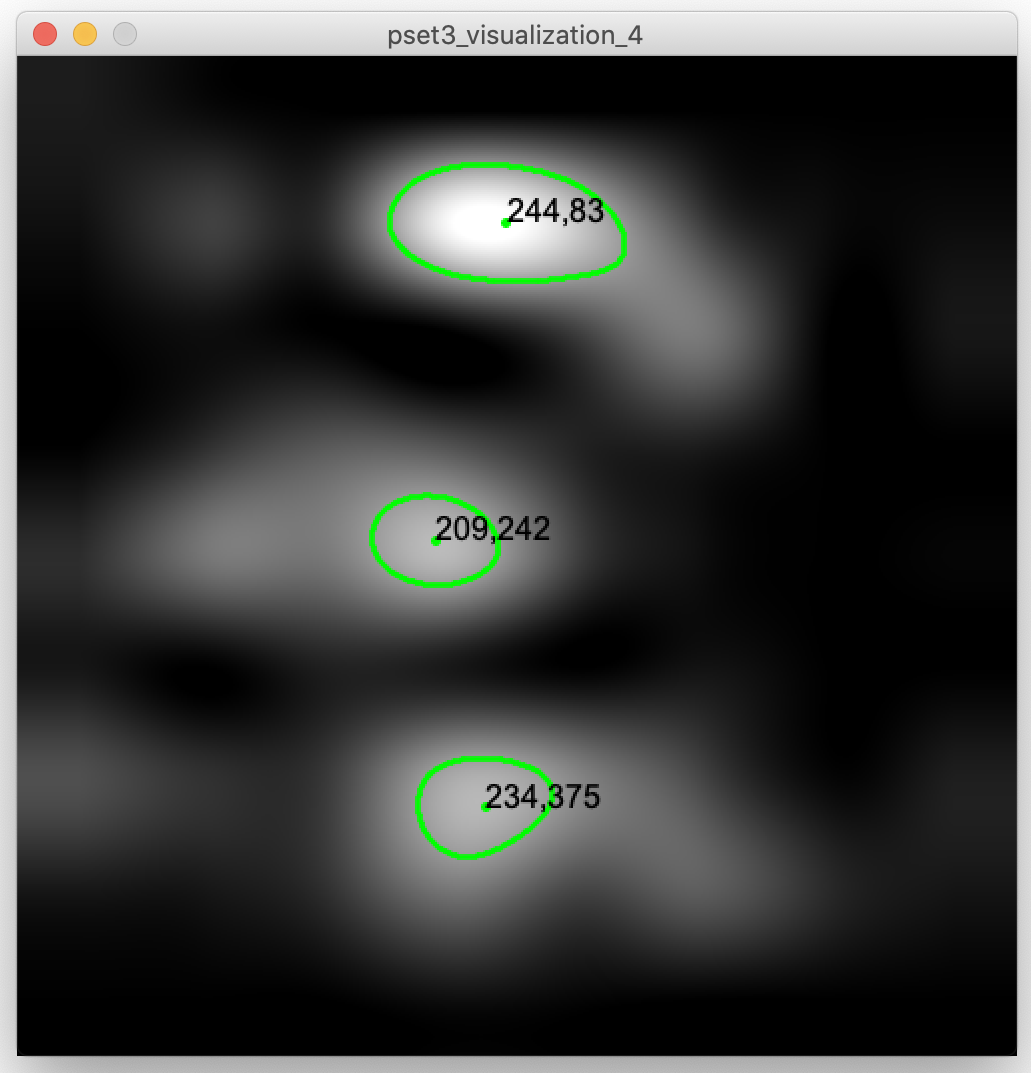
For this part, you will be mainly working on the
setColor() function.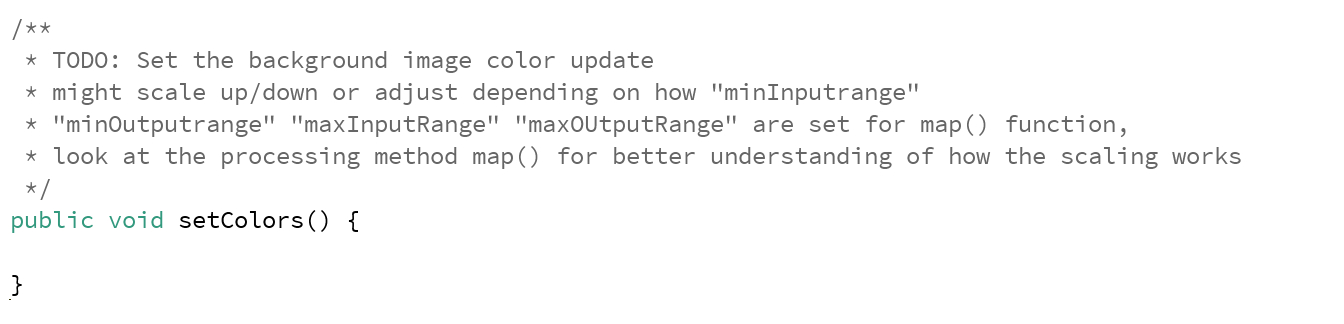
Create 8x9 Pixel Image: Construct an image
PImage the same size as the 2D array that contains the sensing data. This PImage will be a tiny 8x9 pixel image and you will likely have to search a bit for it on screen in case you decide to display it for debugging purposes.Convert Sensor Signals into Grayscale Values: Before we can draw our analog sensor signals into the PImage as
grayscale values, we have to make sure they have the correct range, i.e. are between 0-255. You therefore have to scale your sensor signals accordingly. To scale your sensor values to a range of 0 - 255, you can use the map() function in Processing. As you can see in the documentation of the map() function, apart from the incoming value to be converted, we also have to set four "scaling" values: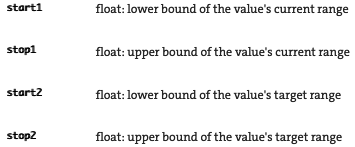
start2/stop2 (target range): The last two parameters are our
target range and are pretty straight forward since we already discussed we want to scale to 0 - 255.start1/stop1 (source): For the source parameters, you can think of these 2 parameters as
min-input-range and max-input-range of your incoming sensing data. To find a good value for the min-input-range, you can print out the no-touch baseline values from Section #2 (i.e. sensing values after the noise substruction), and pick a middle to low value from the different values in the array. To find a good value for the max-input-range, look at the printed values when a touch occurs, and pick a middle to high value. Don't worry about the exact number for now, you may have to adjust them later after we scaled up the image to achieve a cleaner visualization.Draw Grayscale Values into the 8x9 Pixel Image: After you scaled your sensor values, use them to
set the pixel color of each pixel in the 8x9 pixel PImage. If you set a PImage's pixels to a single color value from 0 (black) - 255 (white), it will automatically be treated as grayscale.(5) Scale Up Image Using Bicubic Interpolation
Each sensor value represents the measured value at the intersection of an electrode column with an electrode row. While this gives us8x9 = 72 values, it is a very sparse representation of what is actually going on on the multi-touch pad, i.e. where the user is touching since the user's finger may be in-between rows/columns. To increase the space of sensor values, you can use interpolation to make an informed guess about signal values that would occur in the space between two measured signals. Thus, in the next step, we will first increase the overall image size, then draw in the few pixel values we know for sure, and then use interpolation to guess the grayscale values at each of the pixels that don't have an actual sensor value associated with them.This part will be implemented in the
interpolate() function in the skeleton code (more info below): 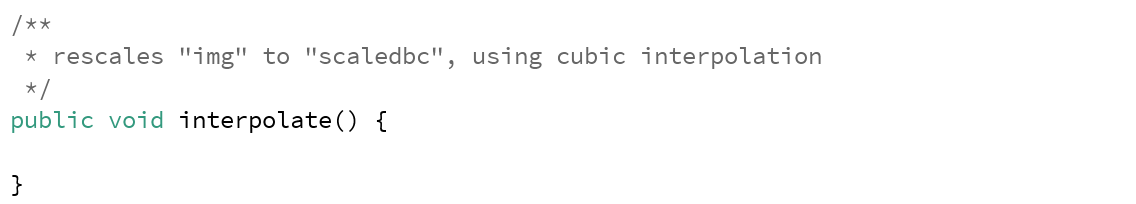
Interpolation Methods: There are many different interpolation techniques that can be used to interpolate the pixel values to create a smooth scaled up appearance of the original input image. Some of simplest interpolation methods are bi-linear and bi-cubic interpolation.
Bi-linear interpolation considers the closest 2x2 neighborhood of known pixel values surrounding the unknown pixel. It then takes a weighted average of these 4 pixels to arrive at its final interpolated value. Bi-cubic interpolation is similar but considers the closest 4x4 neighborhood of known pixels — for a total of 16 pixels. Closer pixels are given a higher weight in the calculation. Bicubic interpolation produces noticeably smoother images than the bi-linear interpolation since it considers more values than bilinear interpolation. However, it also needs higher computational power since more values need to be processed to generate the interpolated value. For our small multi-touch pad with only a few hundred interpolated values this is not an issue but if you had to do more interpolation it may slow the processing down and the multi-touch pad's touch detection would start lagging behind the user's finger movements.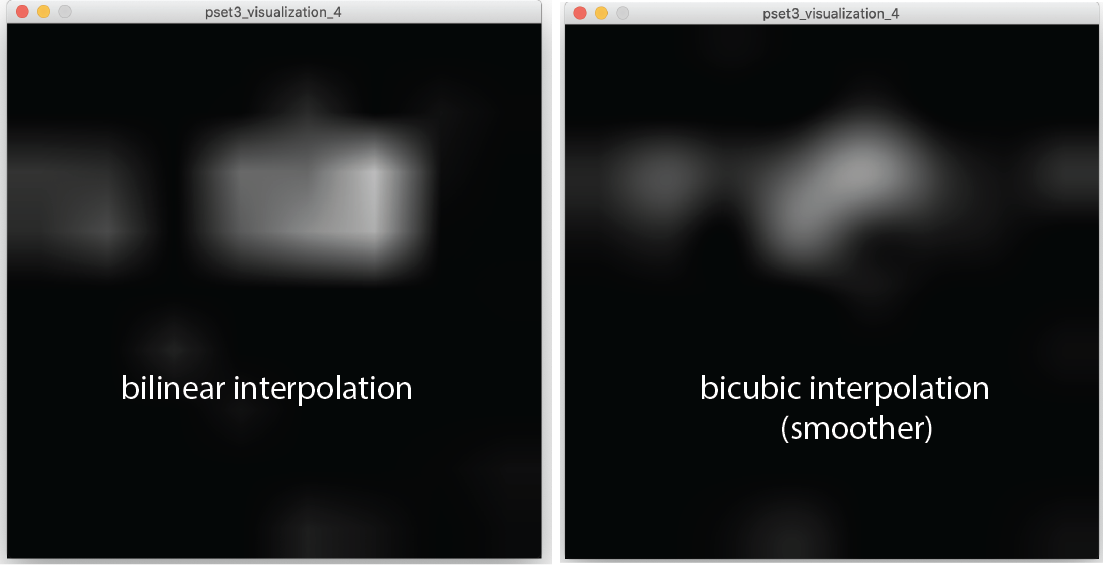
Use OpenCV for Bi-Cubic Interpolation: Luckily, you do not have to implement the bicubic interpolation from scratch. There is an image processing and
computer vision library called OpenCV that has functions for this. OpenCV exists as a library for many different programming languages, in our case we will use OpenCV's implementation for Java and Processing.
Remember, at the beginning of this pset, you already installed the OpenCV library. If you scroll up in your skeleton code, you can see that we already imported several classes of the library with:
import gab.opencv.*;
import org.opencv.imgproc.Imgproc;
import org.opencv.core.Mat;
import org.opencv.core.Size;
Resize Image: If you look at the documentation of the
Imgproc class, you will see that it provides a resize() function, which allows us to specify which interpolation method we want to use.
Mat src: This is the
input image (8x9px) that we want to resize. As you can see, the image here is in the format Mat (Matrix) and not PImage. We therefore first have to convert our PImage into a Mat. In image processing, images are handled as 2D matrices, where every matrix entry is the color value of one pixel (i.e. 0-255 in our case). You can also think of the 2D matrix as a 2D array with pixel values in rows and columns. To convert your PImage into a Mat, first construct a new OpenCV object with the size of the PImage in the constructor, load the PImage via OpenCV's loadImage() function and then call the getGray() function on your OpenCV object, which will return the image as a Mat.Mat dest: This is the interpolated output image. Create an
empty matrix of 500x500px and use it as the parameter. To create the matrix, you can use the constructor from the OpenCV Mat Reference called Mat(int rows, int cols, int type). Similar to how other variables have a type, e.g. int or float, matrices also have types, which refer to what types of values can be stored in the matrix. Since the type of our src matrix and our dest matrix need to match, it is best to directly retrieve the type from the src matrix and then use this as the parameter in the Mat constructor. Check the OpenCV Mat Reference and you will see that each Mat has a type() function that returns you the type.Size dsize: Construct a new
Size object with 500x500px and then use it as the parameter. To see how the constructor works, you can find the OpenCV Size Reference here. double fx, double fy: These are scale factors but since we already created our output image and the size object in the correct dimensions, we don't need to scale our image any further.
Set these to 0.int interpolation: These are the different
interpolation options. If you look at the different fields in the OpenCV Imgproc Reference, you will see that there are several options. We want to use the inter-cubic option.

Convert Matrix back to PImage: After you resized the image, you have to
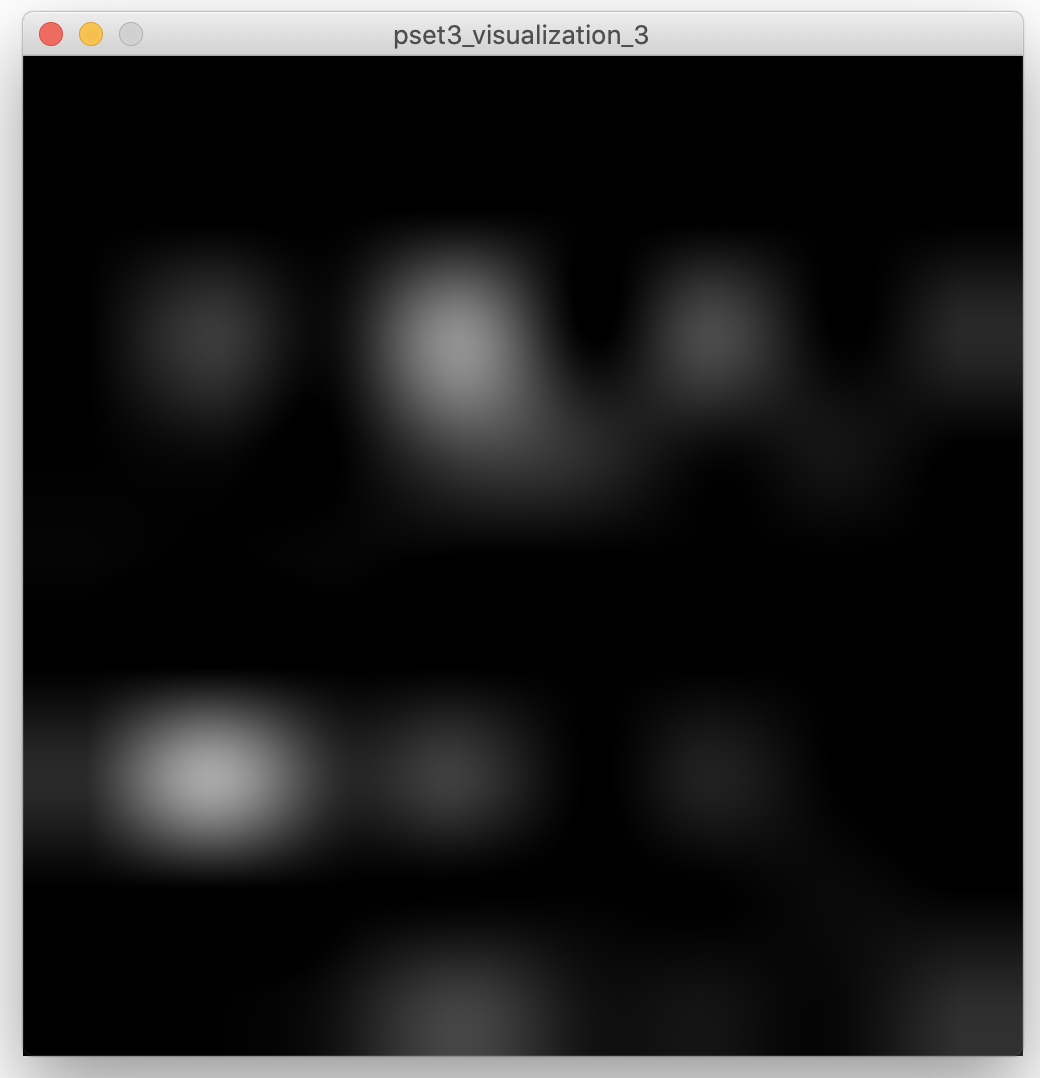
convert your output matrix back into a PImage for use in Processing. For this, you can go back to the OpenCV class documentation and look at the toPImage() function. You will create a new PImage object for the function and use this PImage for later visualization.Check Results: Once you are done implementing, you should be able to see images like the ones below. The image should be
dark when the multi-touch pad is not touched and have some bright spots when the multi-touch pad is touched. If your image is only black or too white, read below for how to improve your results.
Improve Results: If your results don't look as good as above, try
changing how you map your sensors signals to the grayscale values of 0 - 255. Remember, when you mapped your sensor signals to the 0 - 255 range, we had recommended that you use the middle-to-low sensor reading when not touching to map to 0 (black), and the middle-to-high sensor reading when touching to 255 (white). Let's assume for a moment your middle-to-high sensor reading when touching was 1500 and you mapped it to 255 (white). As a result, any sensor reading above 1500 is now leading to white pixels, whereas anything below will lead to darker pixels. If you find that you only see dark areas in your image and nothing is white or just a few pixels are white when touched, then perhaps the 1500 threshold for middle-to-high is too high. Consider using a lower value to increase what signal values are being treated as 'touched' white pixels. Similarly, if you see too much noise in your image, i.e. everything is white or too many areas get large numbers of white pixels when the touch data reads only one finger, perhaps your middle-to-low sensor value is too low and you should set it to something higher so that more signal values are treated as black or dark gray non-touch pixels. While optimizing this right now is not super important, it will become very relevant for the next section when you try to find touch 'blobs'. So revisit this section if your blob detection either finds too few or too many touch points.(6) Blob Detection
While you can now determine with your eyes where the multi-touch pad was touched, your program should also be able to do this automatically and tell you at which (x,y) coordinate it sees a touch point. To do this, we need to write code that detects the whiteblobs in the image. This is called blob detection.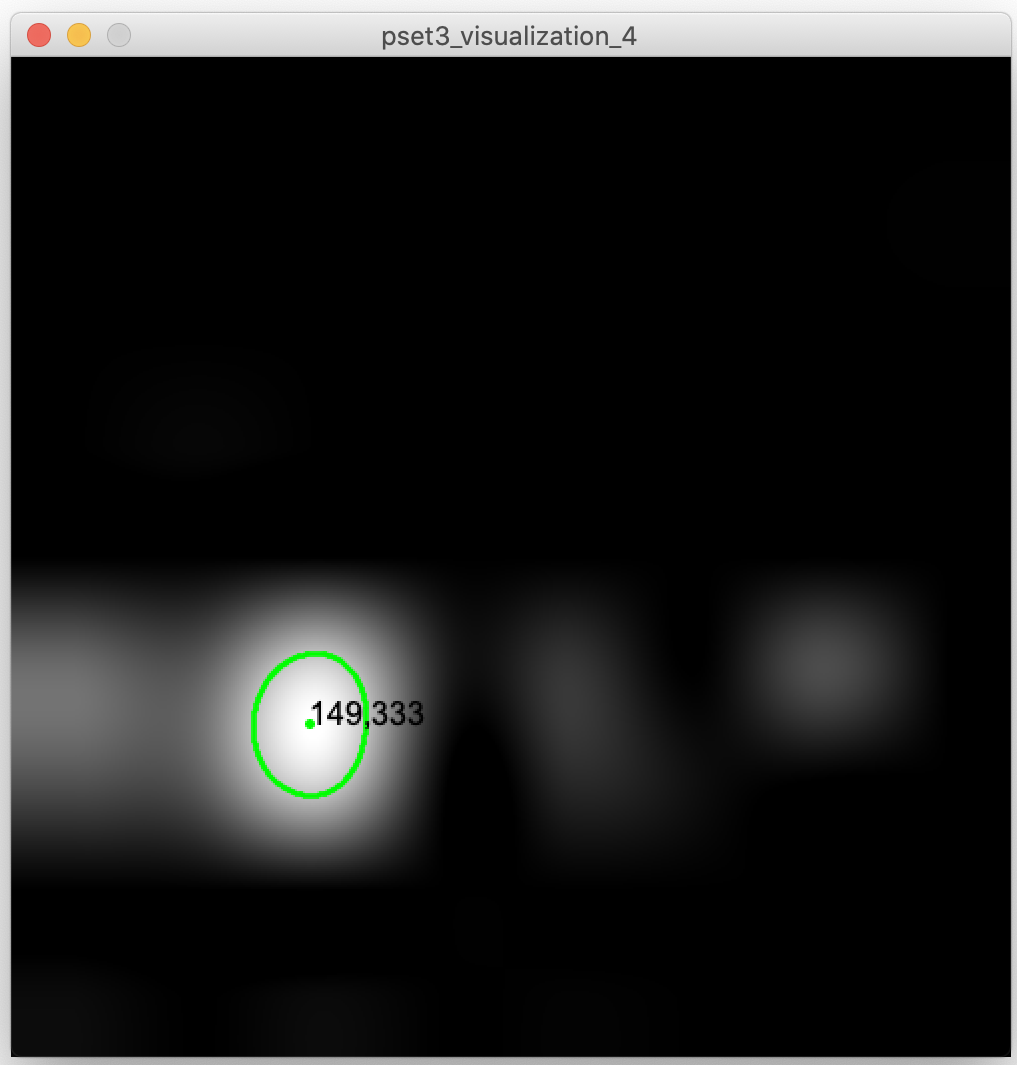
Library for Blob Detection: Luckily, somebody else has already provided a
library for blob detection and you can see the BlobDetection Reference here for details on the different functions. You already installed that library at the beginning of the pset and we already imported it into the skeleton code using the following line:import blobDetection.*;The blob detection code should be implemented in the
drawBlobsAndEdges() function in the skeleton code:
Construct BlobDetection Object: First, construct a new object of the
BlobDetection class, for the size parameters use the large interpolated grayscale PImage height and width. You can find the BlobDetection Reference here.Perform Blob Detection: Next, you can use the BlobDetection instance's
computeBlobs() function to detect the blobs.Retrieve Blob Number: Use the BlobDetection instance's
getBlobNb() function to retrieve the number of blobs (i.e. fingers) in the image. If you get '0' for your blob number, you can debug this by (1) revisiting your mapping of sensor signals to grayscale values (see previous section 'improving your results') and (2) adjusting the blob detection threshold as described in the next section.Improve Results by Changing the Blob Detection Threshold: If your blob detection is not finding all the blobs in your image, consider the following: Before performing blob detection, the library automatically
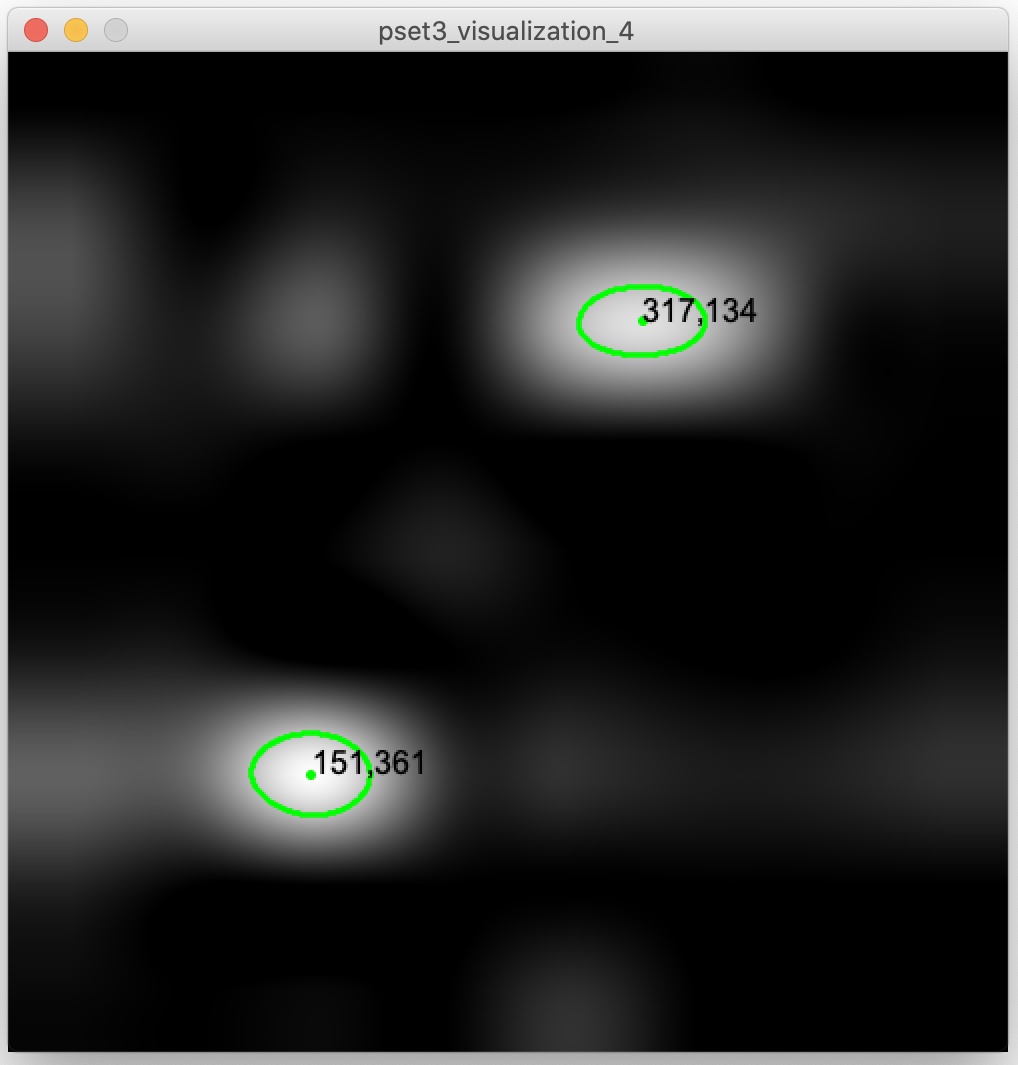
converts your image from a grayscale image (pixel values ranging from 0 - 255) into a black/white image (pixels are either 0 or 255). The reason the library does this is because blob detection groups pixels of similar color together to find blobs and that is easier to do when pixels are either black or white and not something in between. The library automatically picks a threshold value, for instance, it may decide to convert all pixels with a value below '100' to black (i.e. '0') and all pixels above '100' to white (i.e. '255'). If you are not getting any blobs (i.e., groups of white pixels), it is likely that during thresholding all pixels were converted to black and no white pixels are left because the threshold value was set too high. To see if a lower threshold would leave you with more white pixels, you can use the setThreshold() function to determine which brightness levels from 0-255 should be taking into account when searching for blobs. Note that the threshold takes as input a float value from 0-1 so you need to scale your 0-255 values accordingly. Once you set your custom threshold, check again if you now get the right blob number. As a reminder, our prerecorded data contains: no touch (noise baseline), one touch, and two touch points in this order.Draw Blob Centers and Contours Into the Image: Next, we want to extract for each blob: (1) the
center of the blob (i.e., center of the touch point), and (2) the contour of blob (i.e., the outline of the touch point). We can then draw the contour of the touch point into our image, and also add the center of the touch point and its touch point coordinates (x,y) into our PImage. To retrieve the information from a specific blob, you can use the BlobDetection instance's getBlob() function, which returns a 'Blob' object and then use its instance functions to get its blob center and edges (refer to the Blob class in the documentation here). Note that the contour is provided as a list of edges (i.e. lines).Once you are done with the blob detection on prerecorded data, it should look similar to this:
(7) Use Your Own Multi-touch Pad Data
So far, you have only used prerecorded multi-touch data. In this last section, you will use your own multi-touch pad and replicate what you did so far with the prerecorded data.Plug-In Your Multi-Touch Pad: First,
connect your multi-touch pad to your computer.Writing your Own Multi-Touch Data to the Serial Port:
Replace our Arduino .ino program with your own code from pset3 that writes the live multi-touch data to the Serial Port. To make sure your circuit from pset3 is still working correctly, you may want to look at the Serial Plotter to see if the touch signals are being received (see final check in pset3) before moving on.Read your Own Multi-Touch Data from the Serial Port into Processing: Now check in Processing if you can receive your live data there. You may have to do
more cleaning on the incoming string data since live data tends to be a bit more noisy.Recording Noise Baseline Signal: Similar to the pre-recorded data, you need to
record your noise baseline for your live data first. Thus, once you start your Processing program, do not touch your multi-touch pad for 2 seconds. This will use your existing code to record the noise baseline. You don't have to change your code for this.Subtract Noise Baseline from Live Touch Data: Your existing code should already be able to automatically subtract the noise baseline from any touch signal coming in after 2 seconds from the multi-touch pad. You don't have to change your code for this.
Converting Sensor Signals into Grayscales: Remember that we used the
map() function to convert the sensor signals into grayscale values. The map() function required you to define the start1/stop1 (source): parameters (i.e., min-input-range, and max-input-range). You need to adjust these values now that you have live touch data. Check section (4) again for tips on how to find the best values.Adjusting Blob Detection with Custom Threshold: Finally, you may have to
adjust your blob detection threshold since your map() function is now using an updated mapping of sensor values. Refer to section (6) for how to choose a good threshold.Testing your Blob Detection with Live Data: Test your blob detection with
1 finger and 2 fingers touching the multi-touch pad to see if it can reliably determine where the fingers are touching.Deliverables
For grading, please upload the following to your google drive student folder:- the .pde file of your Processing program
- blob detection video using
pre-recorded data:a short video captured with either your phone or a screencast showing the Processing UI detecting the 1 finger and 2 fingers touch blobs from the prerecorded data (.mov or .mp4, no more than 20MB) - blob detection video using
live-data:a short video captured with your phone showing your multi-touch pad hardware and your Processing UI detecting touch blobs when you touch the multi-touch pad with 1 finger and with 2 fingers (.mov or .mp4, no more than 20MB)
Grading
We will give 20 pts in total:- 3pts: you read the sensing data from your multi-touch pad from the serial port into Processing, cleaned the data from misrecognized characters, and saved it correctly into a 2D array.
- 3pts: you recorded the noise baseline and subtracted the noise baseline correctly from the incoming live signal during use.
- 3pts: you created a grayscale image of the correct size and converted the sensor signals into the matching grayscale values using the map() function.
- 3pts: you scaled the image correctly using bicubic interpolation, and the image shows white pixels where the user touches and darker grayscale values everywhere else.
- 4pts: you implemented the blob detection and drew the detected touch point contours and coordinates into the image.
- 4pts: your blob detection also works on multi-touch pad live data.